


This week’s power rankings include the major update of the methodology from a couple weeks back, plus a few tweaks each subsequent week. You’ll see that many of the visuals have changed, and I’m also directly comparing the implied Week 8 win probabilities and point spreads from my power rankings to what prediction markets and sportsbooks are projecting.
The major additions to the methodology are as follows:
Better adjustments for non-quarterback injury clusters
Better decay weighting on older results to improve predictive power
Adjusting dropback efficiencies for PFF grading inconsistencies
Using the Bayesian Quarterback Rankings to estimate quarterback change effects
Daily updating of the paid subscriber Google sheet for injuries and other relevant news items
For more info, you can find the archive of previous Power Rankings posts here, which detail the previous methodology.
TEAM OFFENSIVE AND DEFENSIVE STRENGTH
This plot shows the SOS-adjusted performance for every team in their 2026 games. At the risk of confusing things further, I added arrows next to the team logos to show how they have moved week-over-week. The diagonals represent a 55/45 mix for offense/defense strength, so teams along the same diagonal are roughly equal in total strength.
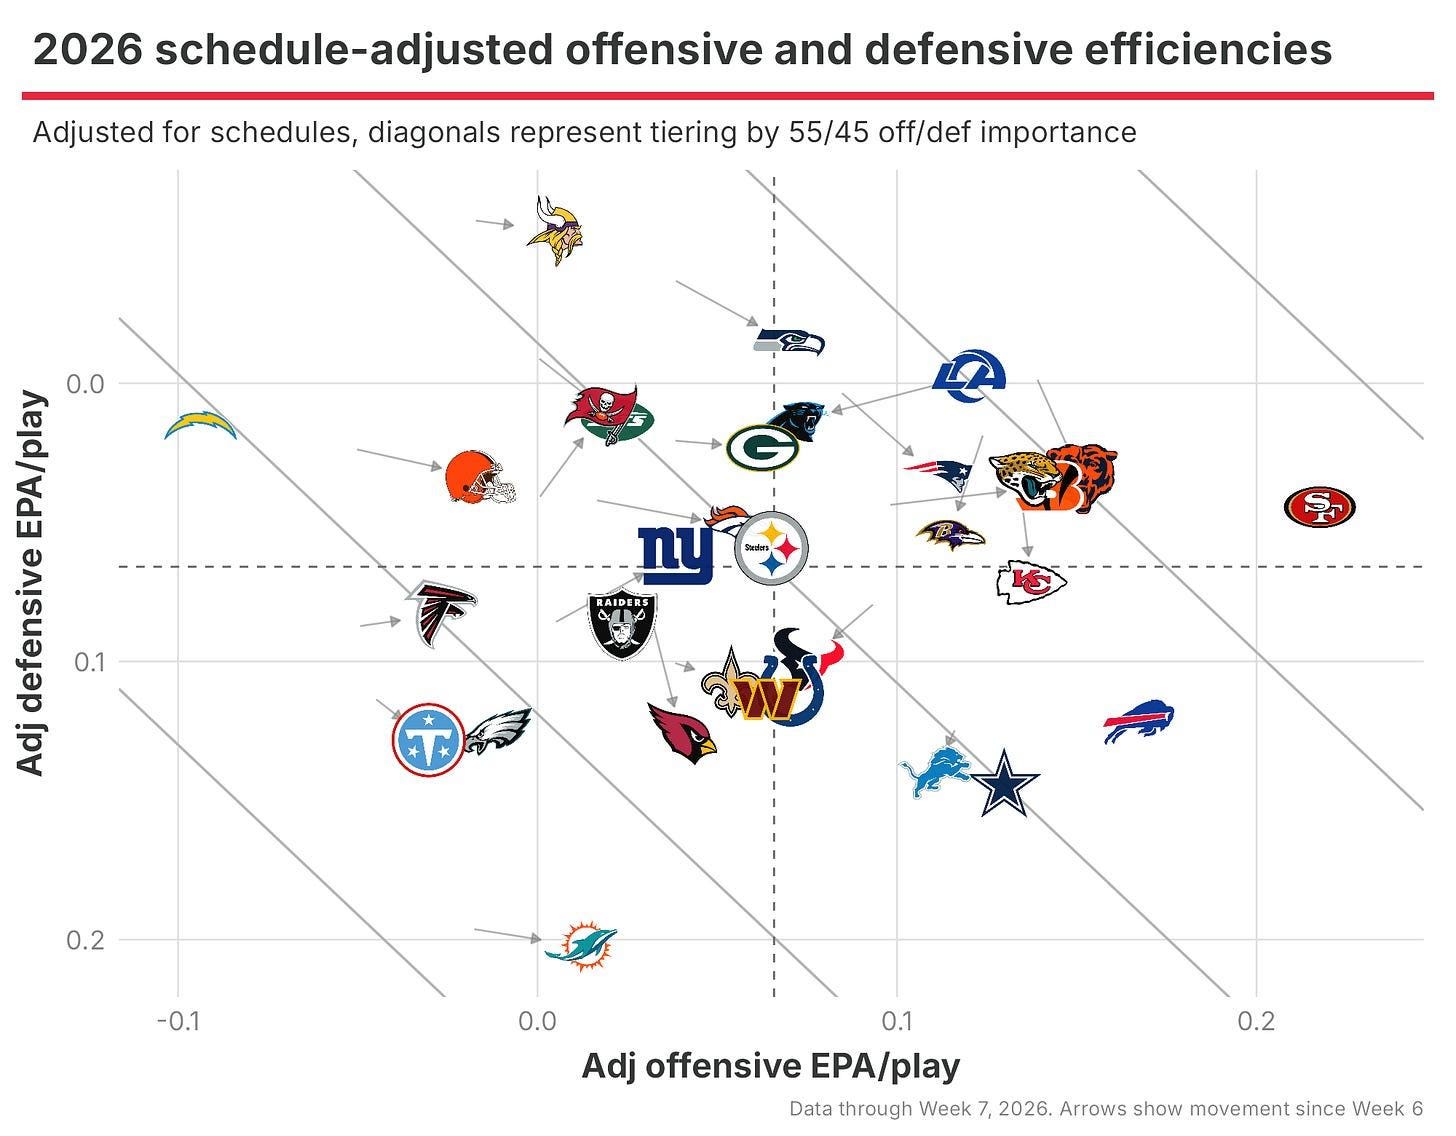
Surprisingly to the average fan, the San Francisco 49ers didn’t move much after their loss to the Atlanta Falcons, maintaining the league’s best offensive performance in 2026, with a slightly above-average defense. The reason is that the adjusted scores model for the game had them as the better team, buried underneath a slew of turnovers that, hopefully, won’t become the norm going forward.
Other movements of top teams include the Chicago Bears falling somewhat in defensive performance after giving up 75th percentile EPA efficiency to the New England Patriots’ offense. However, they maintain positioning as the second-best team so far this year, with their power ranking (see below) a bit lower due to preseason priors and more uncertainty that Caleb Williams has sustainably “made the leap” in this breakout season. Williams is near the top of my adjusted efficiency numbers, but his Bayesian projection is a bit weaker on a lack of sample size.
The Bears are joined in a tight second-tier of teams with the Los Angeles Rams (better defense, worse offense) and have nearly the exact SOS-adjusted efficiencies this year as the Cincinnati Bengals and Jacksonville Jaguars. The Bengals got a big boost in offensive efficiency with their second-half throttling of the Baltimore Ravens, scoring five touchdowns and posting an elite 62% offensive success rate.
The biggest hit was taken by the Carolina Panthers, who fell more on offense than defense, which might seem strange after giving up 43 points to the Tampa Bay Buccaneers. But their game was out of hand so quickly that the Bucs offense didn’t overwhelmingly prove its superiority, getting scoring boosts from a fumble-6, a muffed punt recovery and an extra-point block and 2-point return.
The Kansas City Chiefs also dropped out of the second tier, although not as far as you might think after a pathetic-looking performance on Sunday Night Football. Playing against the Seattle Seahawks defense on the road is always challenging, so the effect on their offense was a bit muted.
In the lower half of the NFL, the Denver Broncos, New York Giants, Cleveland Browns, and New York Jets all moved up, mostly due to offensive success.
POWER RANKINGS VERSUS THE BETTING MARKETS
Let’s start with the power rankings (exact numbers updated daily for injury news on the subscriber Google sheet) before heading to the markets.
*Power rankings and “Model to Market” analysis updated as of 10/27, 10:00AM ET.
