The adjusted scores quantify team play quality, with emphasis on stable metrics (success rate) and downplaying higher variance events (turnovers, special team, penalties, fumble luck, etc). Adjusted expected points added (EPA), in conjunction with opportunity-based metrics like total plays and drives, projects adjusted points. Adjusted scores have been tested against actual scores and offer slightly better predictive ability, though their primary benefit is explanatory.
All 2025-2022 and historical Adjusted Scores and other site metrics are available in a downloadable format to paid subscribers via Google Sheet.
Find previous advanced reviews here
** Adjusted Scores table:
“Pass” - Pass rate over expectation (based on context of each play and historical averages
“Success” - Success rate on offense, a key metric in adjusted score vs actual
“H & A” - Home or away team
Falcons vs 49ers (-2.5, 57%)

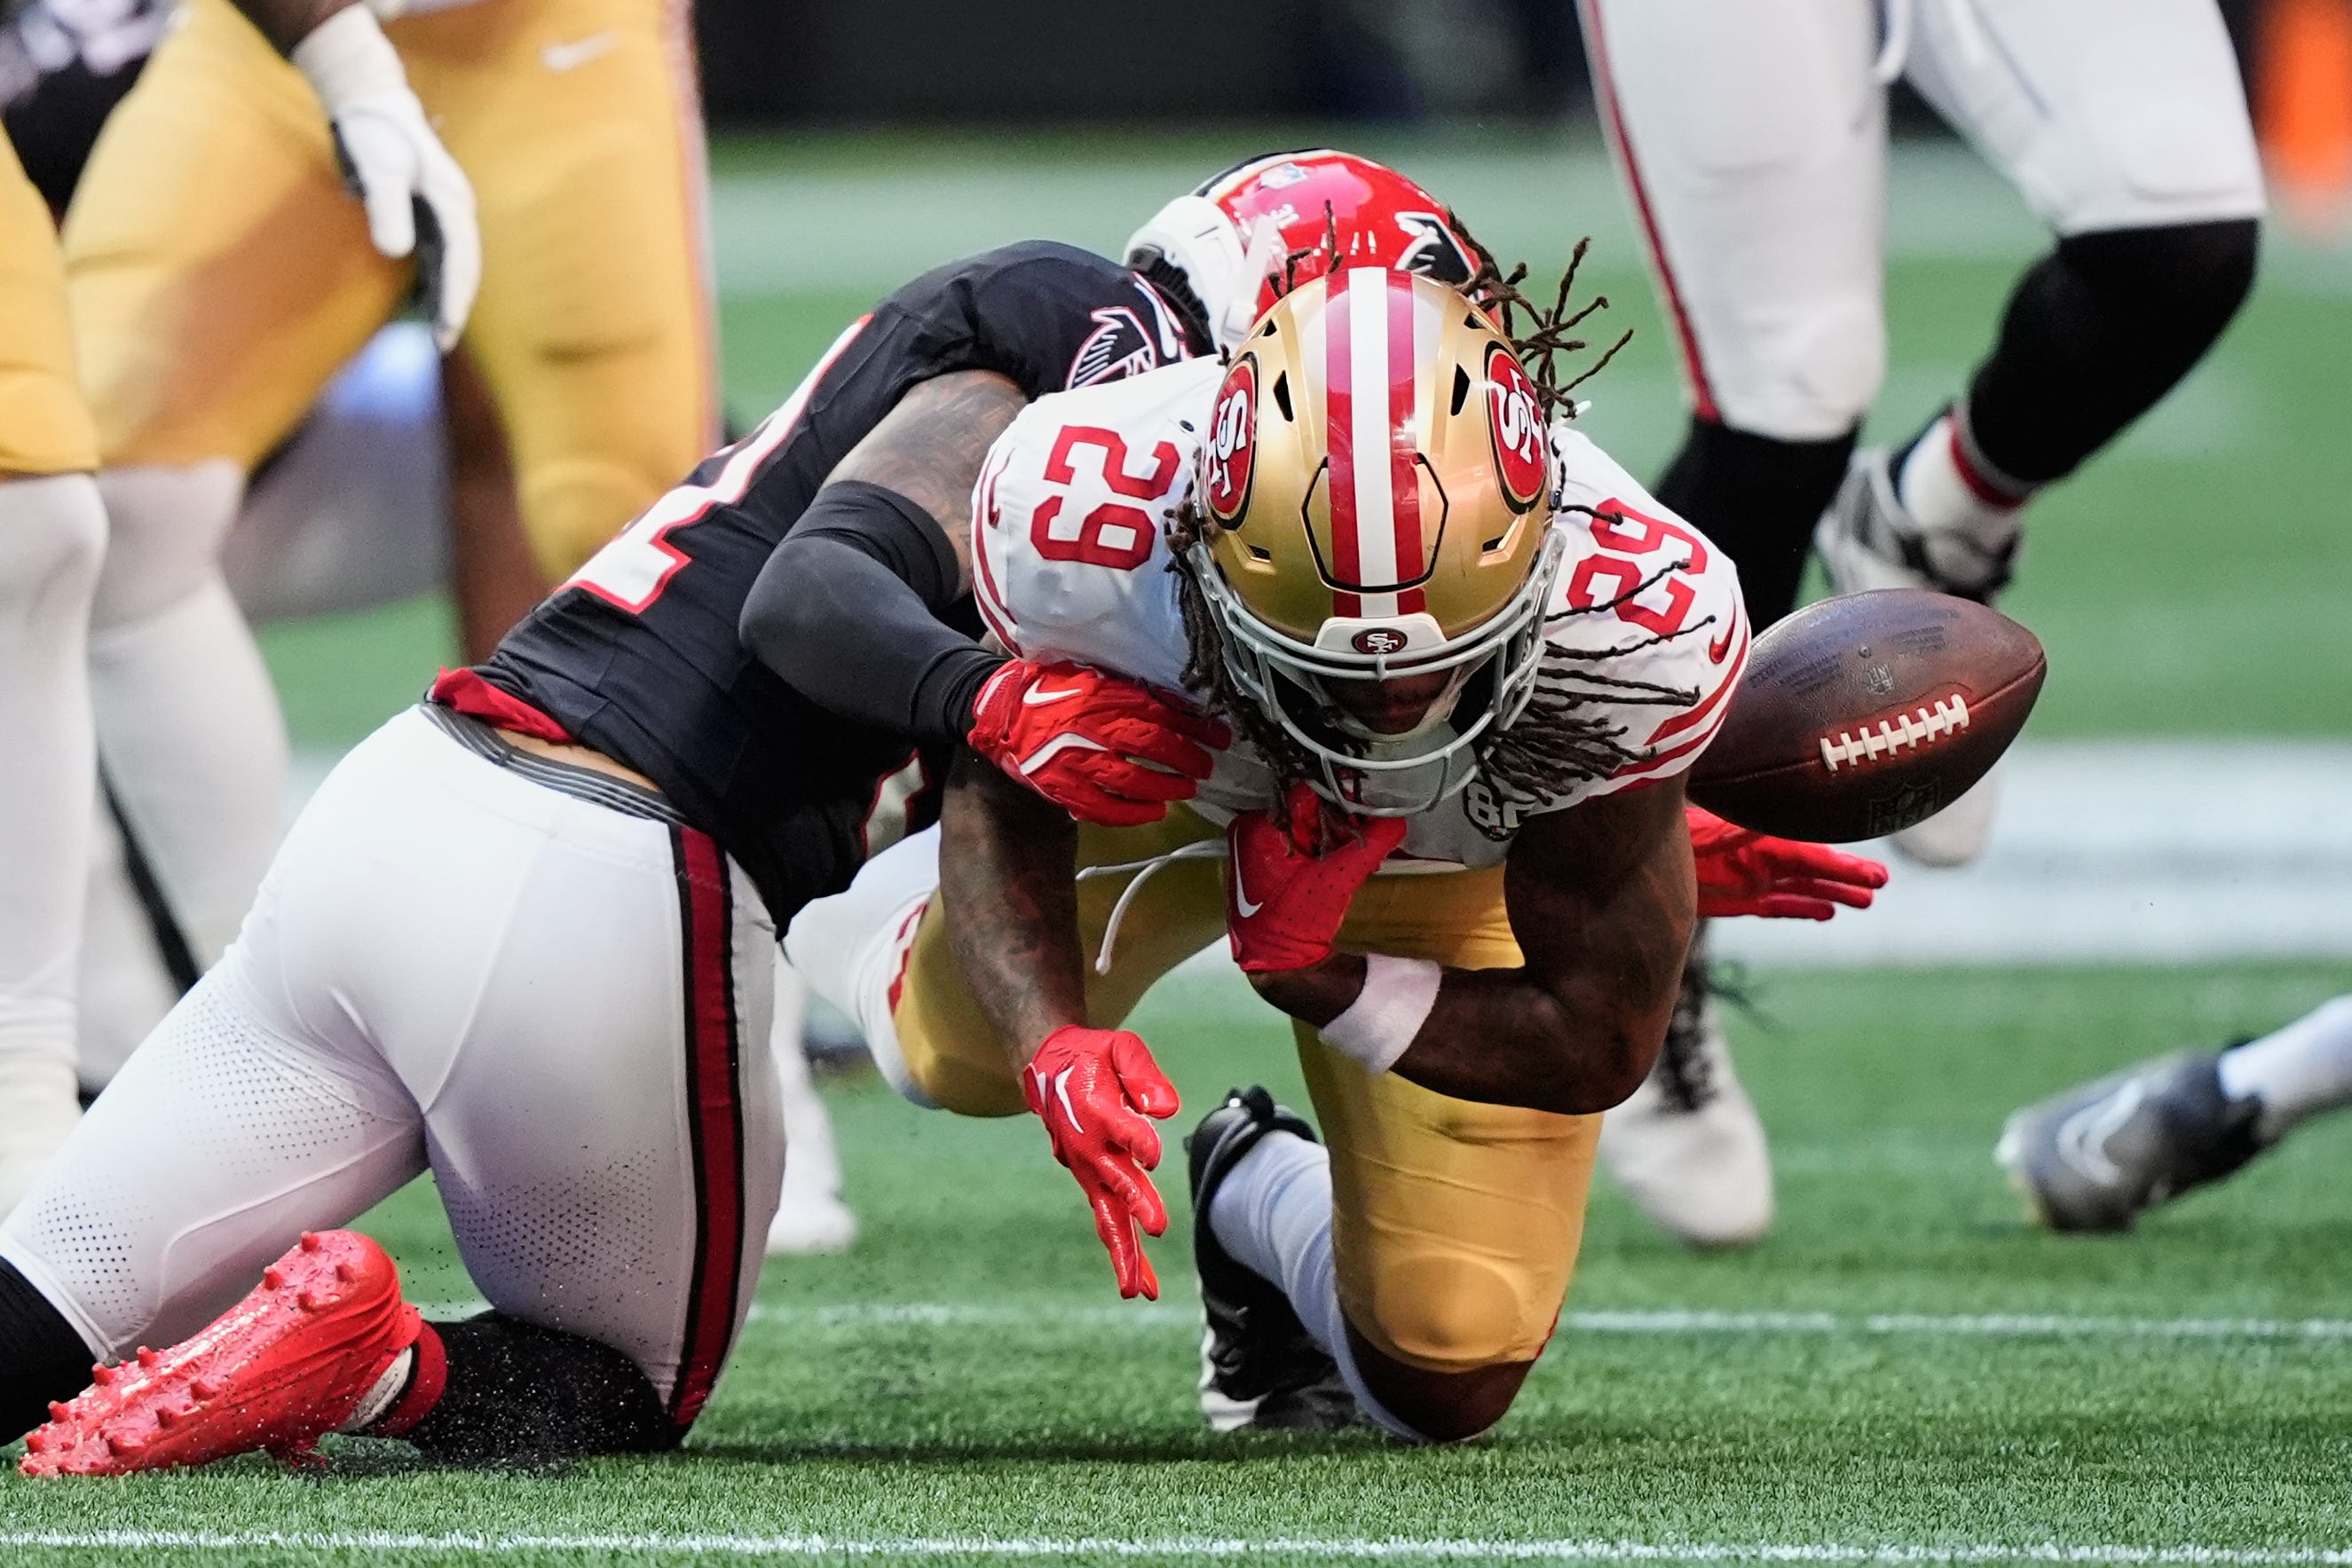
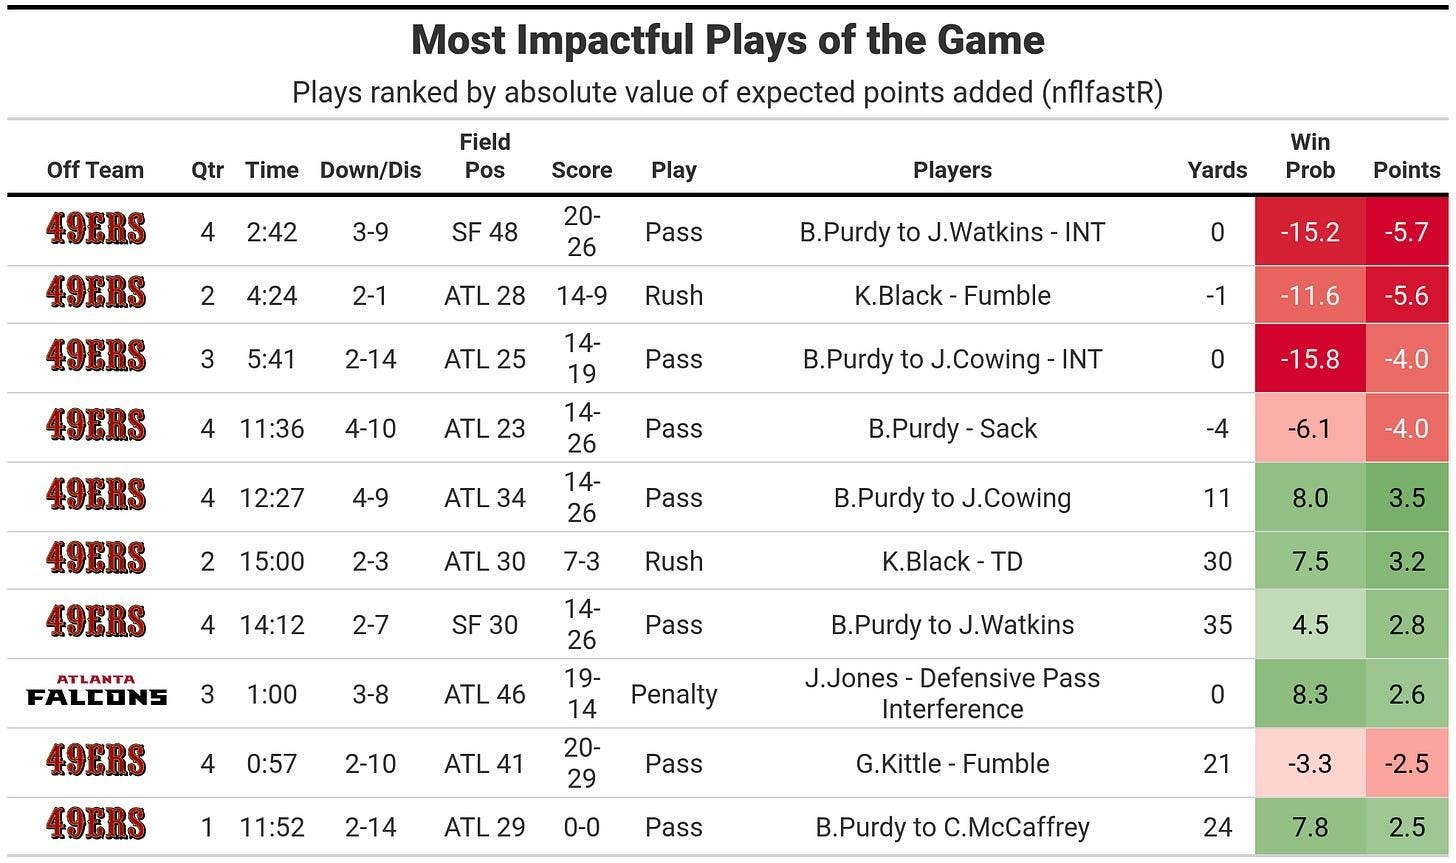
Big swing in the adjusted scores versus actual, with a nine-point differential in favor of the Atlanta Falcons moving to the San Francisco 49ers being three points better by the fundamentals. The 49ers had a materially better 55.2% offensive success rate (48.5% for the Falcons), but got crushed by four turnovers totaling 17.8 expected points lost (zero for the Falcons).
The 49ers’ win probability peaked at around 84.2% early in the second quarter, up 14-3. The 49ers turned the ball over on five of their next six possessions, if we include a turnover on downs, going for it on 4th-and-10, down 12 points on the ATL 23. Fourth down models had the win probability slightly leaning towards kicking it in that situation, which was ironic considering the fourth down discourse around Kyle Shanahan all week.
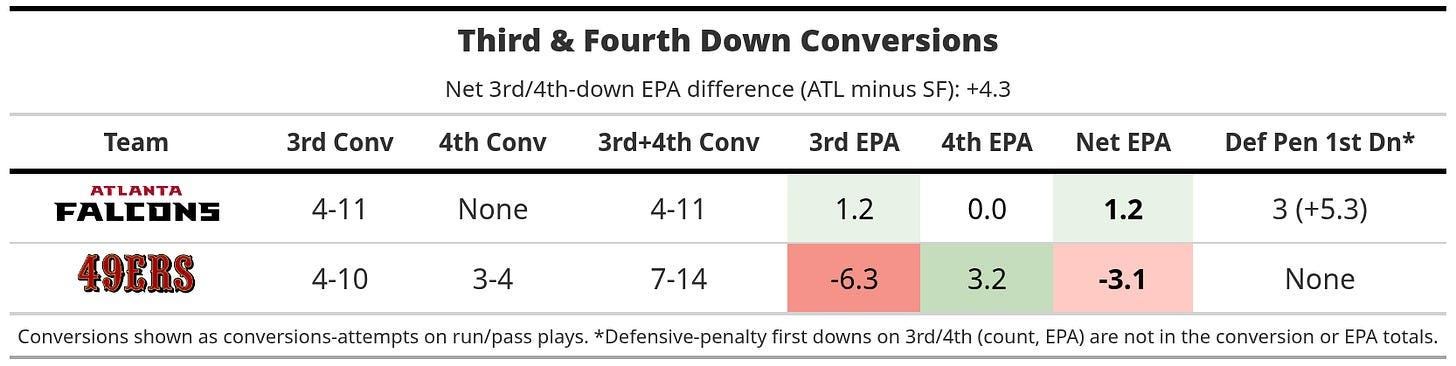
It was a pretty good offensive showing for the short-handed 49ers, who totaled substantially more yards at a more efficient clip, but had their dropback EPA efficiency crushed by turnovers.

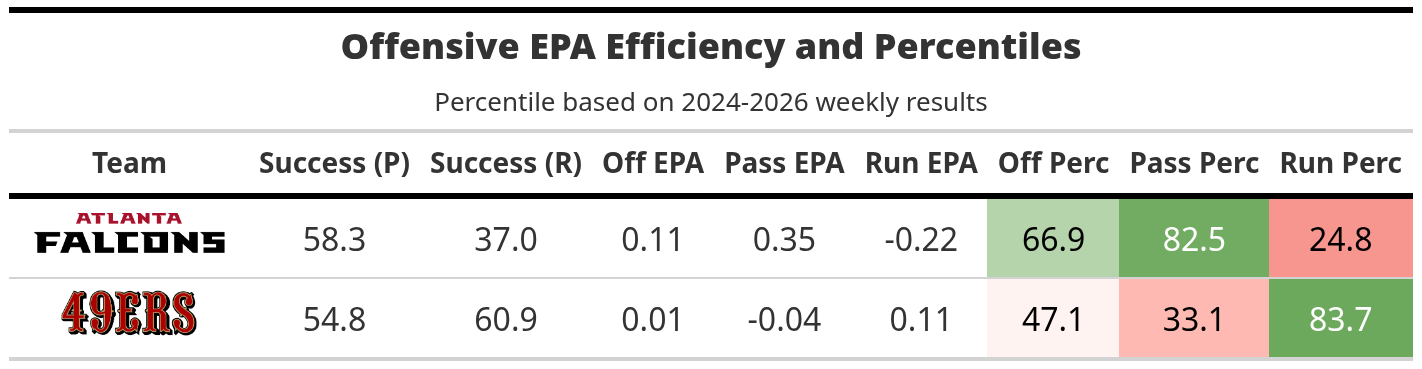
The Falcons’ run game has been weak the last couple games, only averaging 3.3 YPC and losing 0.22 expected points per rush. The 49ers added +0.11 EPA per rush, despite losing 5.6 expected points to a Kaelon Black fumble, the second costliest play of the game.
The four biggest EPA and WPA swings in the game were mistakes for the 49ers, three turnovers and the 4th-and-10 failure.
Brock Purdy’s two interceptions were the game’s biggest win probability swings: -15.8% (Q3, Jessie Bates at the ATL 10) and -15.2% (Q4 2:42, Kendal Daniels, -5.7 EPA).
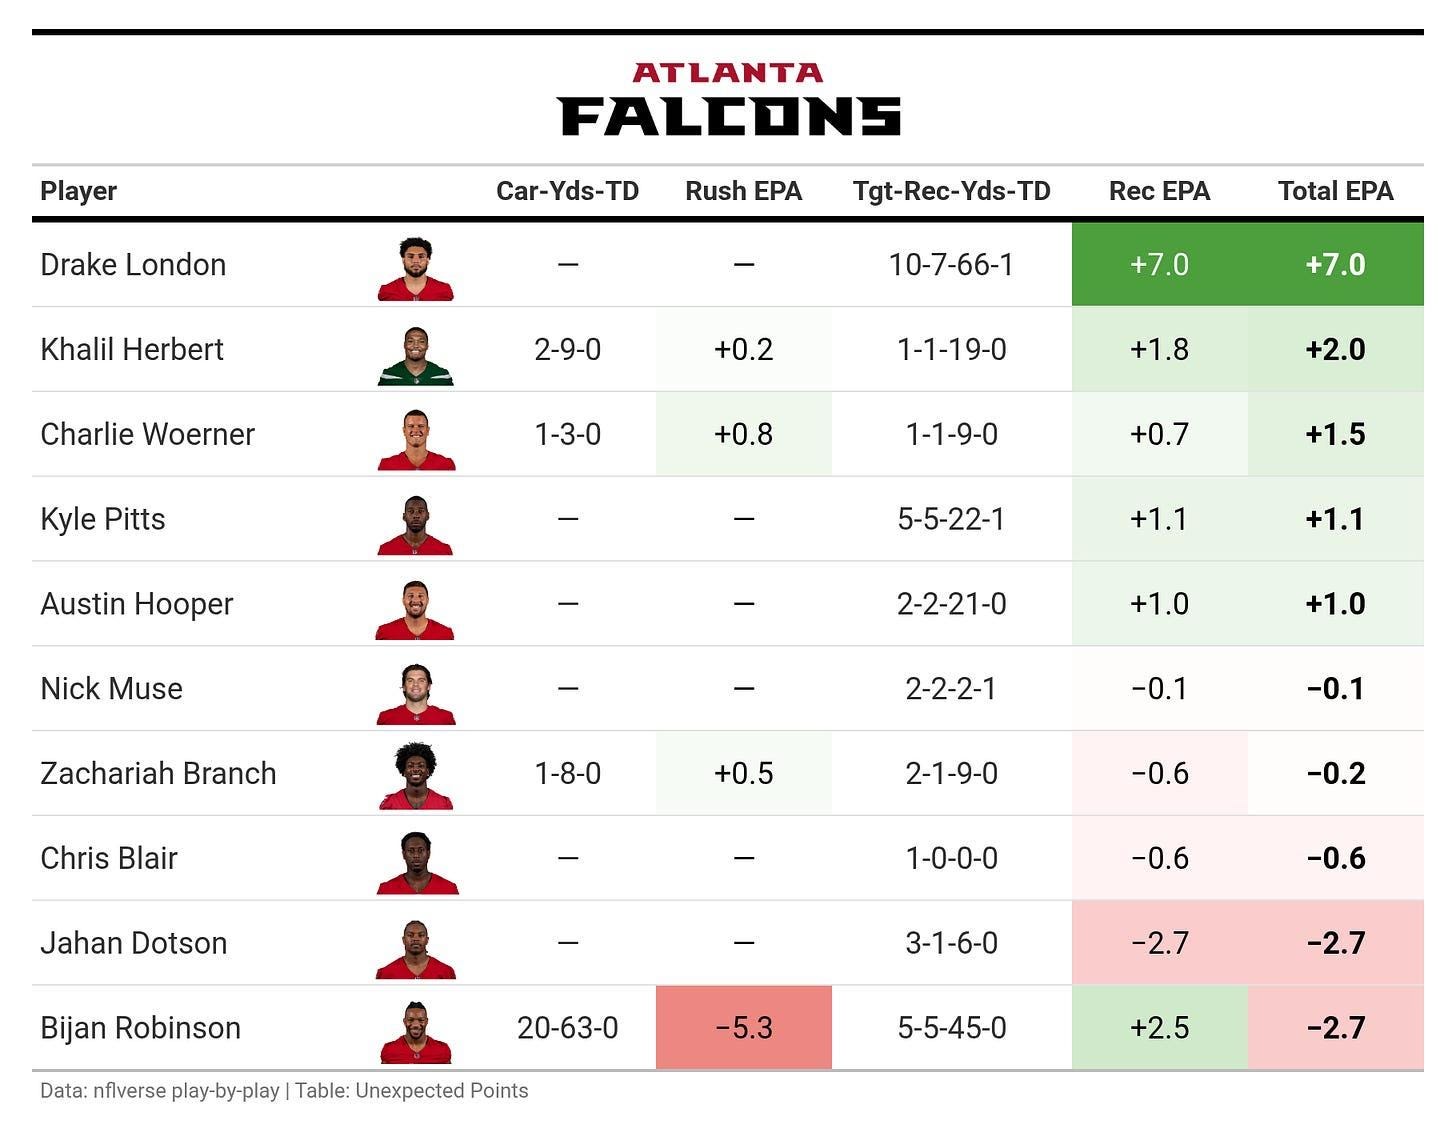
Drake London finished with seven catches for 66 yds and 1 TD on 10 targets, totaling +7.0 EPA.
Bijan Robinson was inefficient on the ground (63 rushing on 20 carries, -5.3 EPA), but caught all five of his targets for five catches and 45 yds (+2.5).
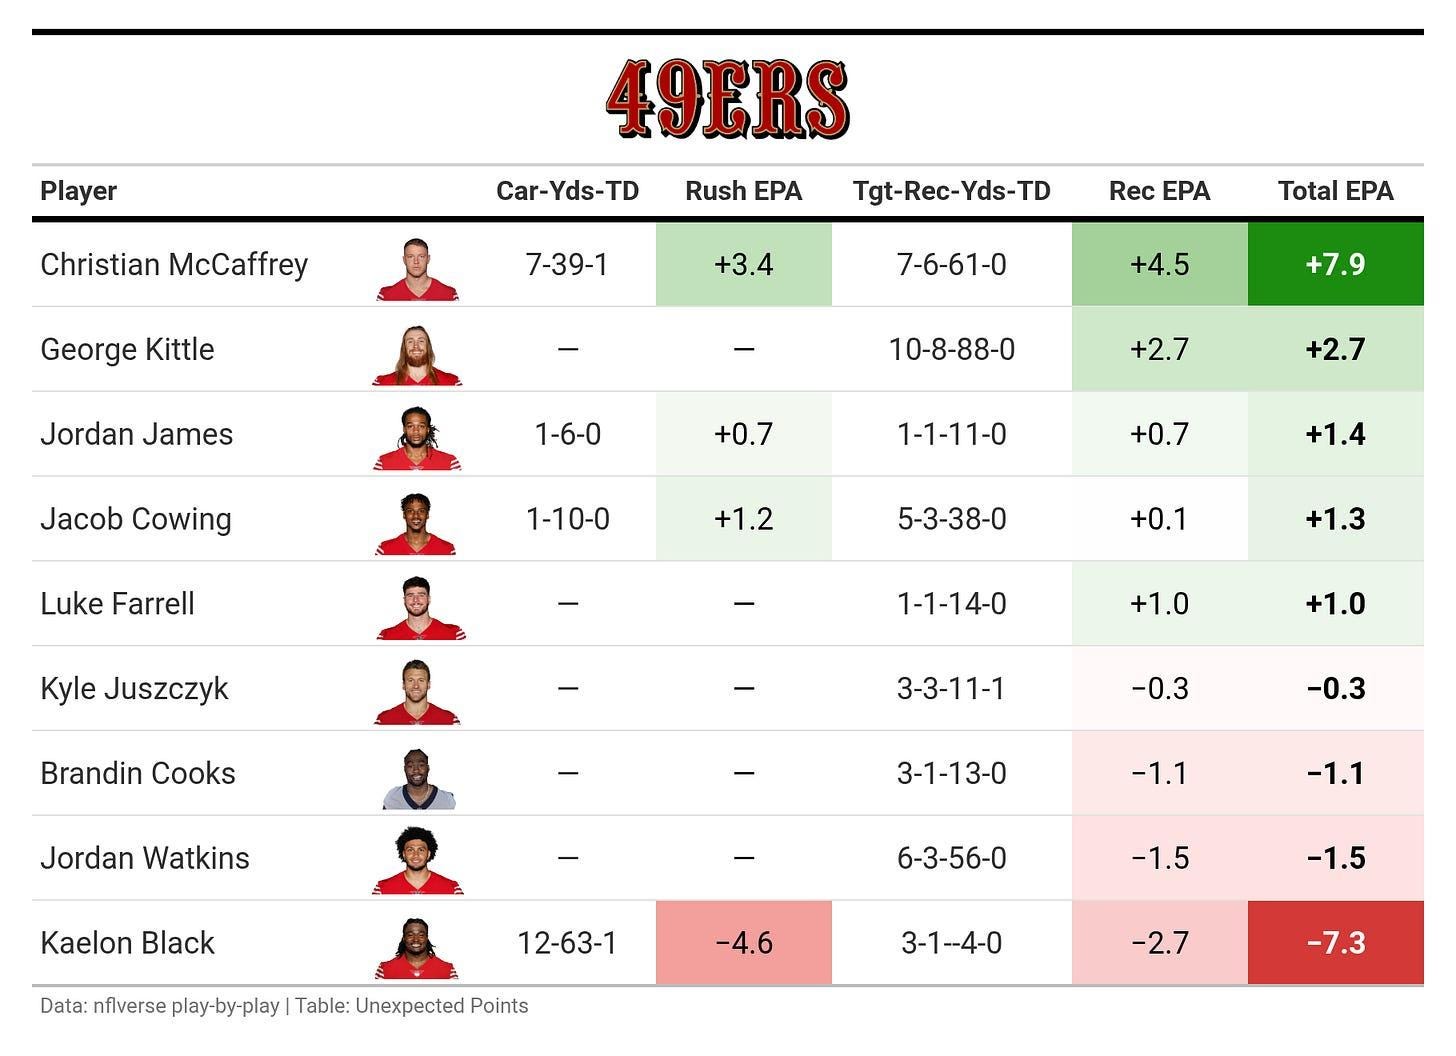
Christian McCaffrey left the game and came back later, limiting his work on the ground to seven carries for 39 and a score, adding six catches for 61 yds on seven targets. McCaffrey totaled +7.9 EPA, the best of any non-QB in the game. McCaffrey’s loss was acutely felt in light of the 49ers’ thin receiving group.
Kaelon Black ran fairly well, but his fumble more than offset the positives from 12 carries for 63 and a touchdown.
Brock Purdy, in a way, did well to finish with positive EPA after losing 15 expected points to turnovers and sacks. He had +17.2 pass EPA on non-INT pass attempts, with most of the value coming via air yards.
Michael Penix wasn’t special, but completely avoiding turnovers and sacks lifted his EPA efficiency to elite territory (+0.34 per play).

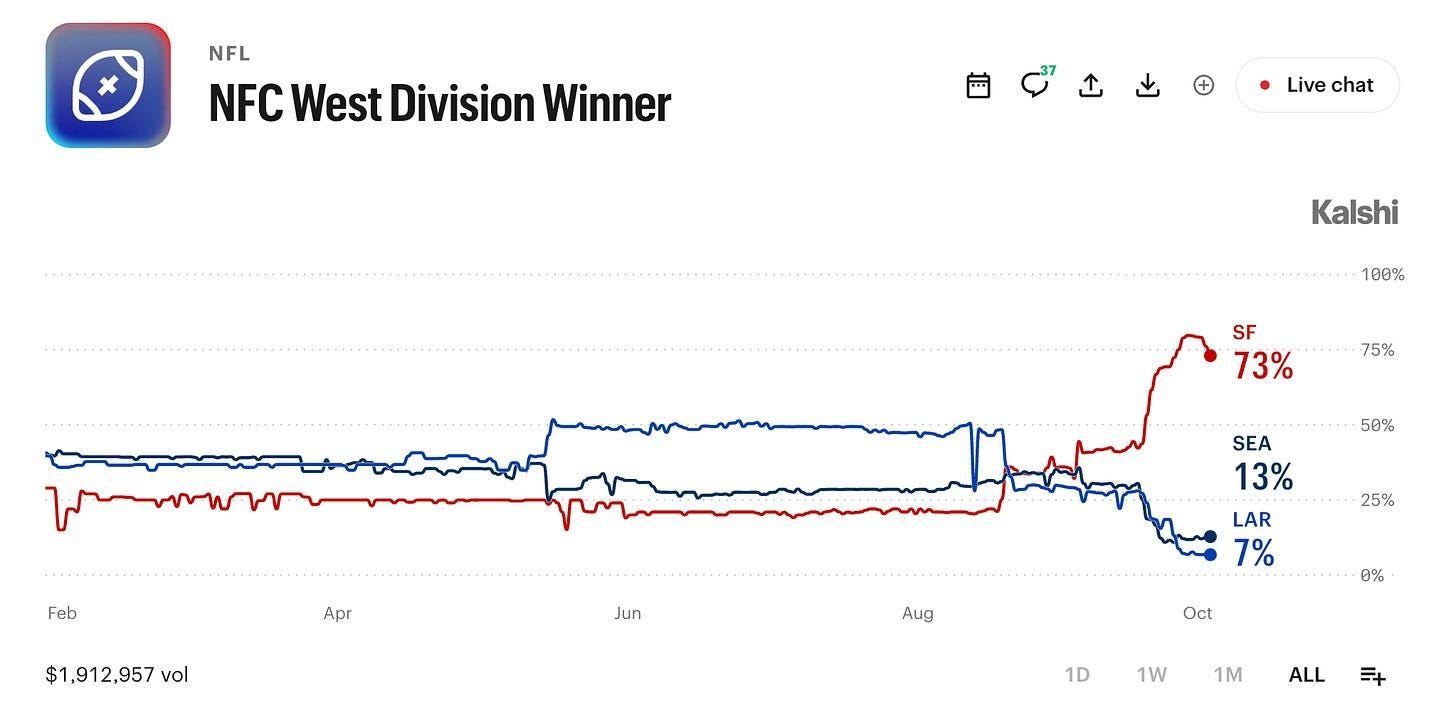
As of 5:13PM ET, the 49ers’ chance to win the NFC West in prediction markets was at 73%, down from as high as 79.6% leading into the game.