


This analysis is my best attempt to discount and adjust various elements of quarterback efficiency and get to the number that most accurately reflects fundamental play. There are a number of elements of quarterback efficiency - which also directly affect team performance - that are more dependent on luck (variance) than skill.
I aggregated many of those luck-based elements, with additional factors like passing scheme ability to generate yards-after-catch, in my Adjusted Quarterback Efficiency (AQE) metric.
The measures that I believe are most luck-based and part of this analysis:
Interceptions: FTNData tracks “interception-worthy throws”, which I compare to actual interceptions on a play-by-play basis, and also adjust for expected interception return. Longer INT returns have a dramatic effect on the EPA, whether the quarterback’s fault or not.
Drops: I calculated the expected drop rate for throws, based on location, and compared it to actual drops and determined the EPA lost/gained.
Fumbles: Whether a fumble is recovered by the quarterback’s own team or not can turn a slightly negative play into a massive loss. I look at expectations for recovery based on different types of fumbles, and whether the quarterback himself recovers the fumble or a teammate (luckier).
Yards After Catch: A higher portion of yards after catch should be credited to receivers or scheme than to the quarterback, at least in comparison to throws where the yards gained were mostly through the air. I adjust down EPA generated on passes with a relatively high proportion of YAC.
Sacks caused/prevented by blocking and scheme: I introduced this element in 2024, using survival curve analysis that accounts for time-to-pressure, time-to-throw and contextual play elements from FTNData’s charting. Through this, I can divide sack credit/blame versus expectation into holding the ball too long (quarterback) and allowing pressure too quickly (offensive line). I back out the portions belonging to blocking.
Defensive Pass Interference: There are so many underthrown balls that turn into big DPI gains that need to be recognized as partially luck. By their very nature, DPIs are not “open” receivers; the coverage defender is close enough to affect the receiver.
Strength-of-Schedule: This is the one element that is most difficult to judge this early in the season. With a handful of games played, a great offense can have a bigger effect making the defenses they played look “bad”, and vice versa, than might be the truth. But it still matters.
Weather: Based on expected EPA gains/losses versus average in different elements, based on wind, humidity and temperature.
If you want more details on many of the calculations, check out the Adjusted Quarterback Efficiency (AQE) primers from last season.
Archive of past AQE posts, including my analysis of who deserved the 2023 MVP, the 2024 MVP and the 2025 MVP leveraging this metric
YTD 2026 ADJUSTED EFFICIENCY RESULTS
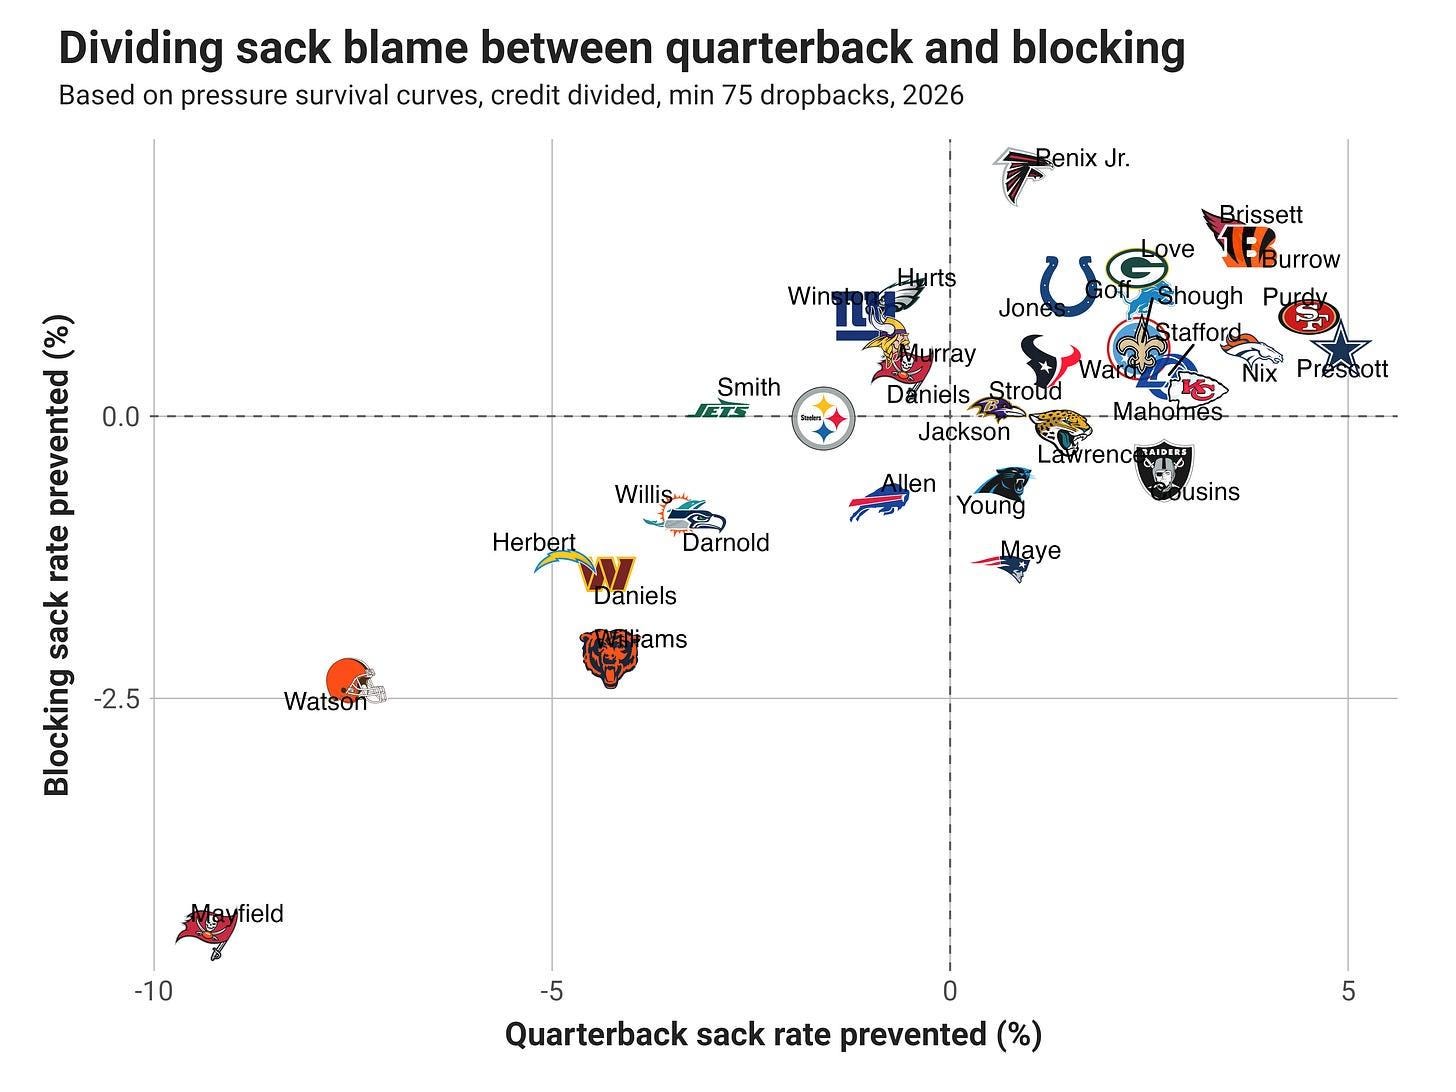
First, here’s the chart for sack adjustments, with particular note that my model estimates holding onto the ball too long (i.e., quarterback) is responsible for most of the sack rate over expected, and time-to-pressure (i.e., blocking) a lower amount. Sacks are a (mostly) quarterback stat.
The next plot below shows each quarterback who has been involved in at least 90 plays this season (dropbacks plus designed runs). There are two points for each quarterback: 1) The team-colored dot for the actual EPA per play the quarterback has this season and 2) The quarterback headshot representing the adjusted quarterback efficiency (AQE, Adjusted EPA/play). There is also a team-colored line linking the two on each row.
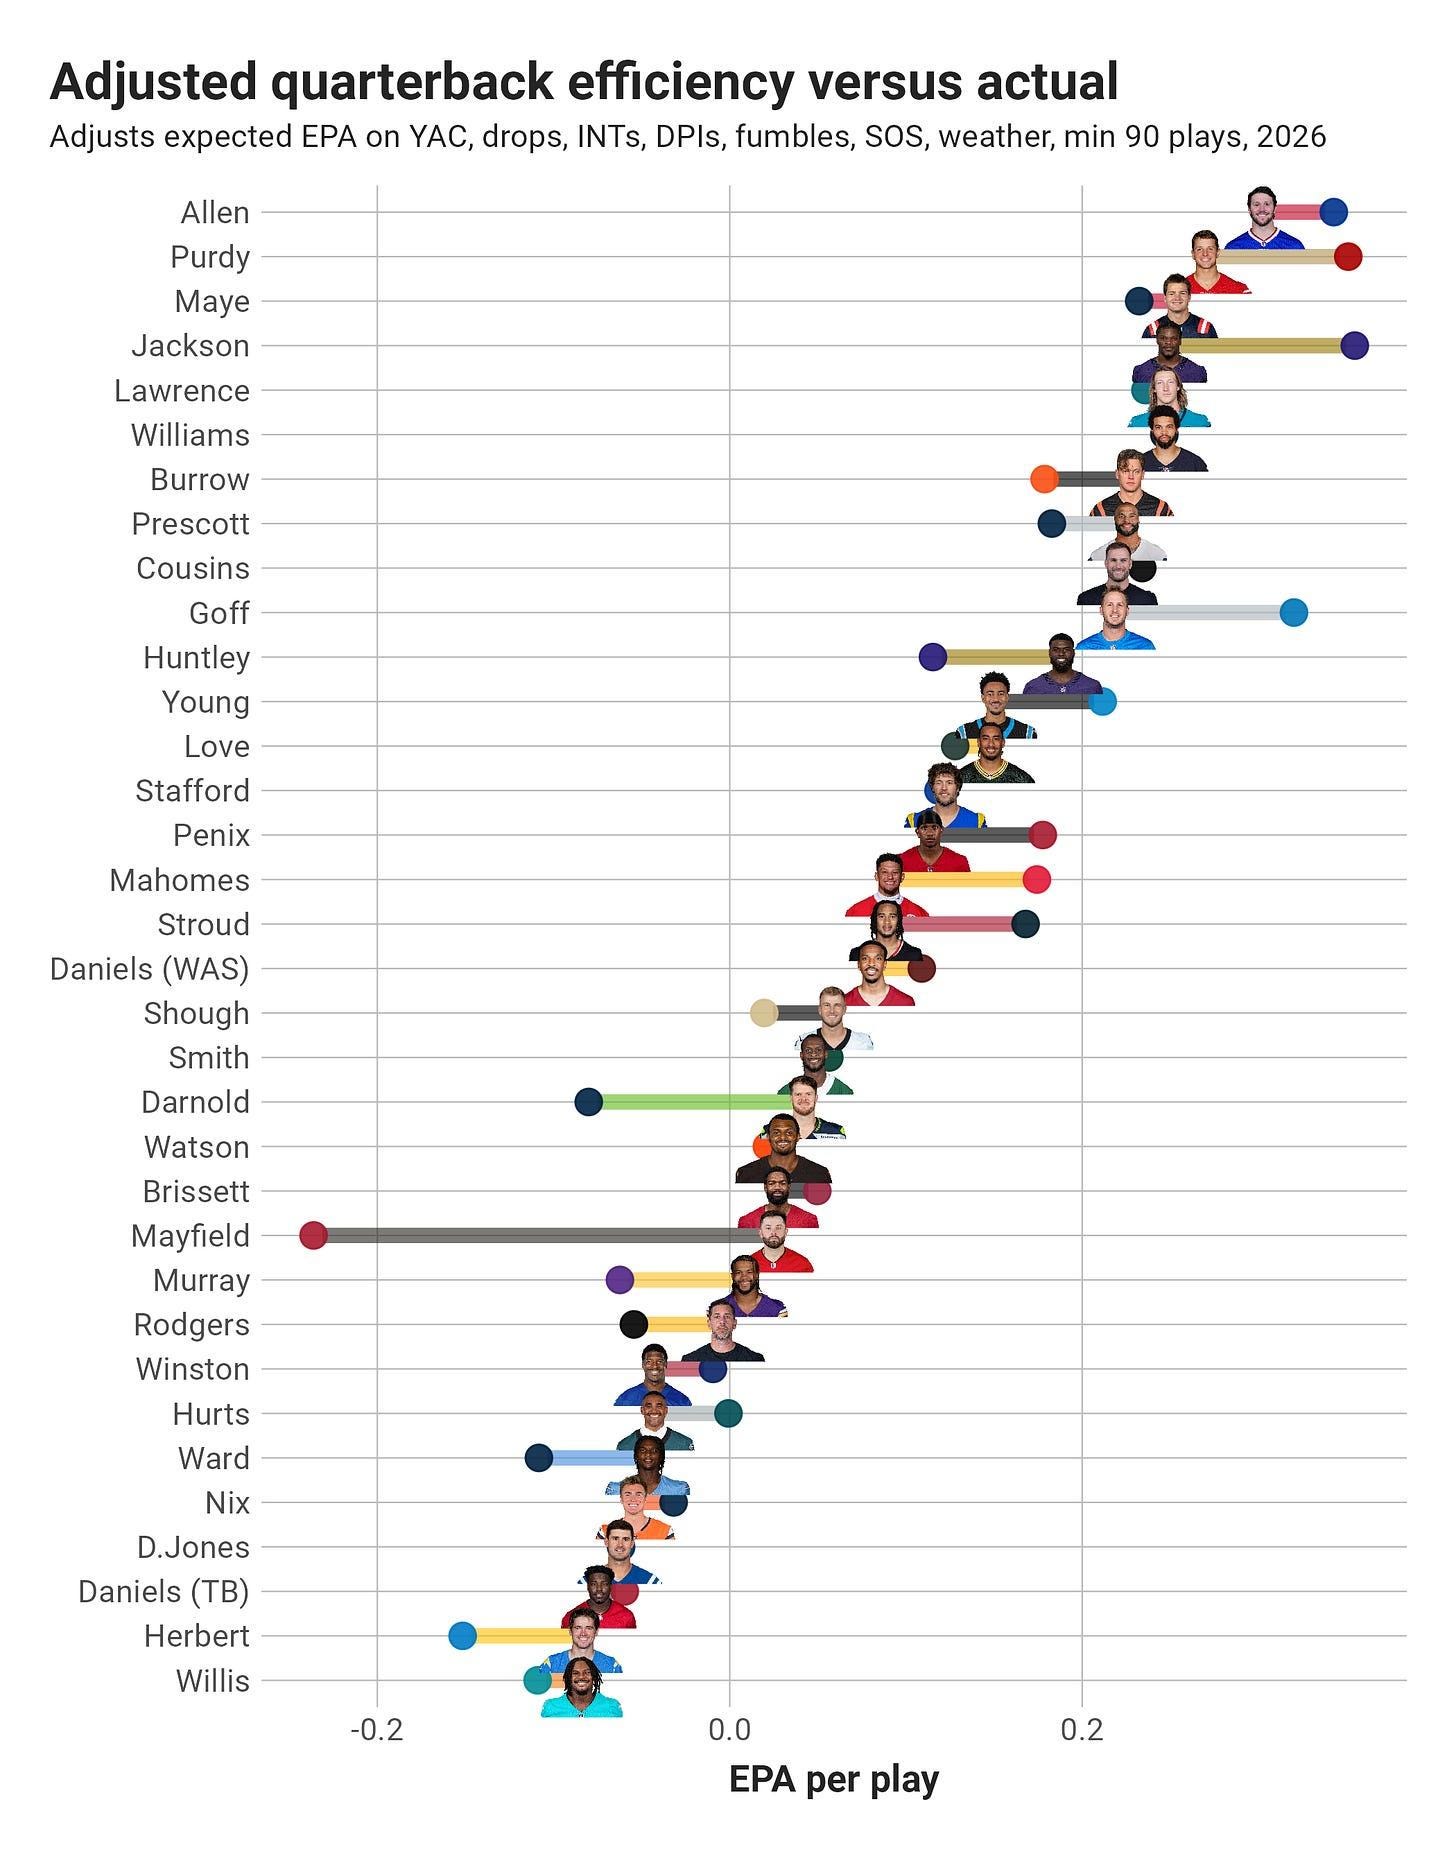
Josh Allen trails Lamar Jackson and Brock Purdy in raw EPA/play, but suffers lower negative adjustments than both. You can see in the table below that Allen leads the NFL in total raw and adjusted EPA by roughly 10 EPA in both categories. His usage has been a bit higher than Purdy’s, with 37 more plays through six games. But Purdy’s usage has ticked up this year, and Jackson has missed enough time to make his per-play numbers not truly comparable to other starting quarterbacks.
C.J. Stroud had the strongest week for adjusted EPA (+16.2), followed by Drake Maye (+13.7). Stroud’s seasonal number takes a bit of a hit from his weaker strength of schedule, plus his receivers have had fewer than expected drops. Maye is on a real tear the last few weeks, moving from being seen as a “disappointment” three games into the year, all the way to third in AQE following three more.
The next two best Week 6s came from Trevor Lawrence (+12.3) and Jordan Love (+11.3), with the former an AQE darling for many seasons, but never finishing in the top-5 where he currently resides. Love has been on the long march up the rankings for the last few weeks, now just outside the top-12. It’s funny how early season performance and perceptions can have Love with a meh year so far and someone like Bryce Young “breaking out” with the same efficiency. Though I should acknowledge that Young has a better PFF grade, which likely reflects how they’re viewed.
Sam Darnold has gotten a lot of grief for the Seattle Seahawks’ disappointing start. But he’s only been mediocre by AQE, excluding the effects of poor luck that have driven his production down further. Following the TNF loss last week, I went into why it would be a big mistake for the Seahawks to turn to Drew Lock.
The worst performances of the week were by Bo Nix (-10.3), Jayden Daniels (-8.7), Daniel Jones (-8.5) and Michael Penix (-8.0). Penix has tumbled from having the same AQE as the leaders after his first two starts to the middle of the NFL.
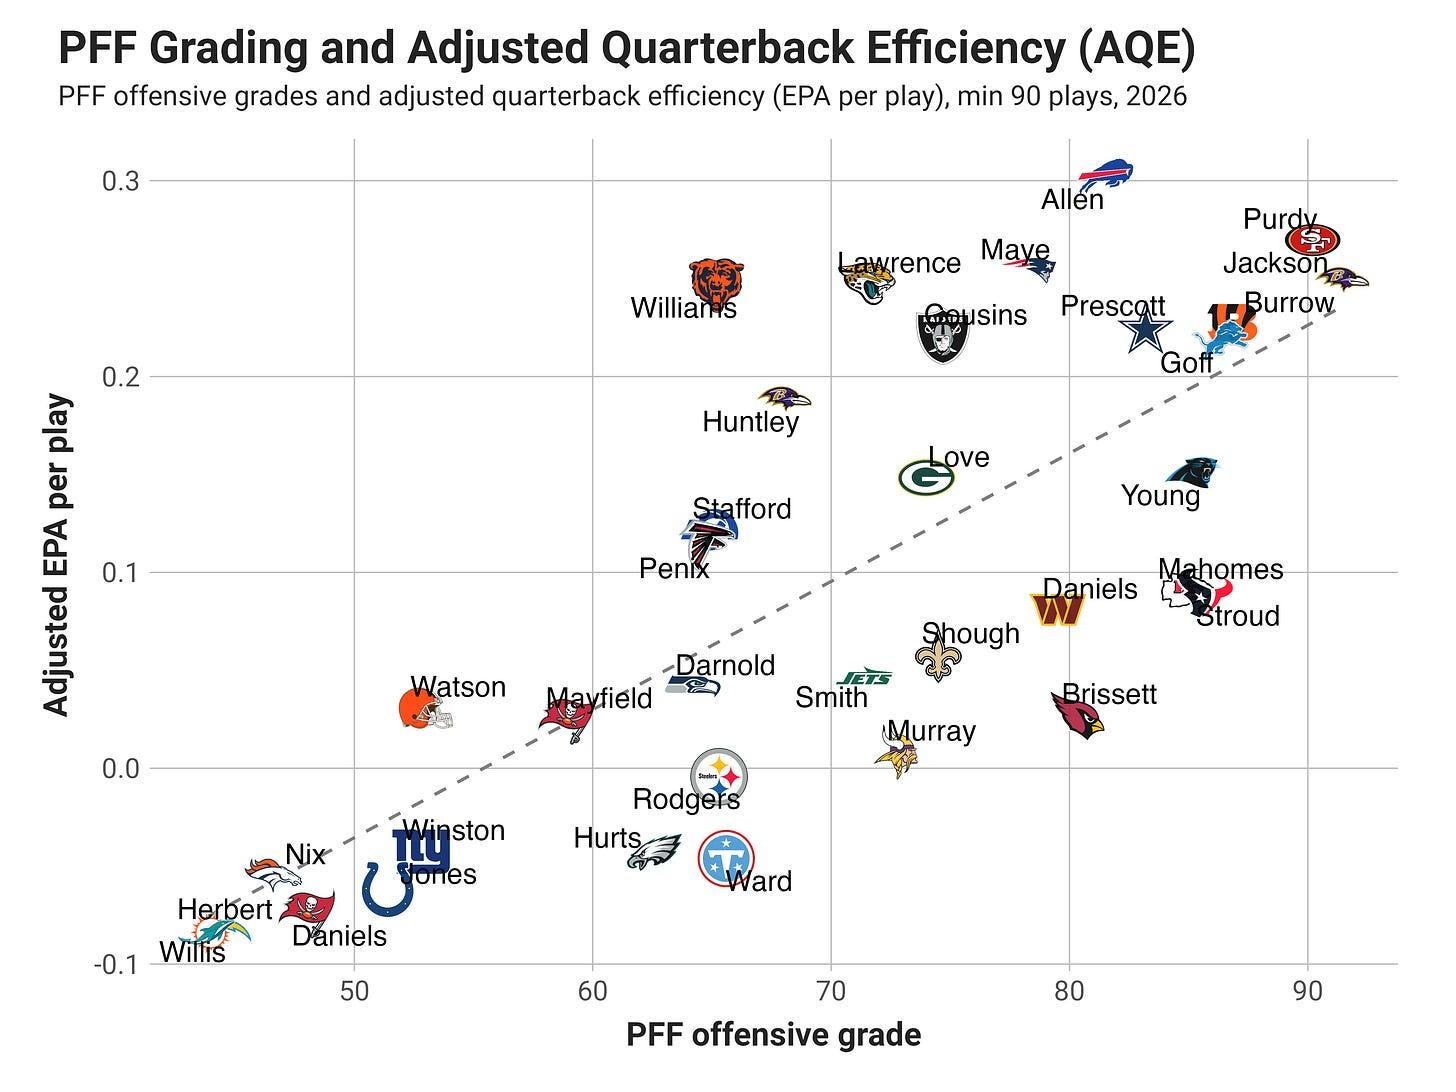
Last week, I advocated buying Josh Allen at roughly 26% win chance on prediction markets, when Brock Purdy was at 30%. Now they’re in a virtual tie around 30% after a better performance by Allen, and I’d still lean towards him being the better bet. That said, the Bills defense is not great, coming in at 15th in my Week 7 Power Rankings. But the 49ers defense ranks even worse at 17th.
Looking at longer-odds quarterbacks, the obvious +EV choice for me
