

Who is the real 2024 NFL MVP? Adjusted Quarterback Efficiency (AQE)
In a razor-thin contest for NFL MVP, the majority of metrics lean slightly in one direction


This analysis is my best attempt to discount and adjust various elements of quarterback efficiency and get to the number that most accurately reflects fundamental play. There are a number of elements of quarterback efficiency - which also directly affect team performance - that are more dependent on luck (variance) than skill.
I aggregated many of those luck-based elements, with additional factors like passing scheme ability to generate yards-after-catch, in my Adjusted Quarterback Efficiency (AQE) metric.
The measures that I believe are most luck-based and part of this analysis:
Interceptions: FTNData tracks “interception-worthy throws”, which I compare to actual interceptions on a play-by-play basis, and also adjust for expected interception return. Longer INT returns have a dramatic effect on the EPA, whether the quarterback’s fault or not.
Drops: I calculated the expected drop rate for throws, based on location, and compared them to actual drops and determined the EPA lost/gained.
Fumbles: Whether a fumble is recovered by the quarterback’s own team or not can turn a slightly negative play into a massive loss. I look at expectations for recovery based on different types of fumbles, and whether the quarterback himself recovers the fumble or a teammate (luckier).
Yards After Catch: A higher portion of yards after catch should be credited to receivers or scheme than quarterback, at least in comparison to throws where the yards gained were mostly through the air. I adjust down EPA generated on passes with a relatively high proportion of YAC.
Sacks caused/prevented by blocking: I introduced this element in Week 3 of 2024, using survival curve analysis that accounts for time-to-pressure, time-to-throw and contextual play elements from FTNData’s charting. Through this, I can divide sack credit/blame versus expectation into holding the ball too long (quarterback) and allowing pressure too quickly (offensive line). I back out the portions belonging to blocking.
Defensive Pass Interference: There are so many underthrown balls that turn into big DPI gains that need to be recognized as partially luck. By their very nature, DPIs are not “open” receivers with the coverage defender close enough to affect the receiver.
Strength-of-Schedule: I calculate strength-of-schedule adjustments by determining pass defense effect through modeling similar to that described by Alok Patani here. Each quarterbacks’ game results are then adjusted up or down by a certain amount of EPA per play based on opponent.
Weather: Based on expected EPA gains/loss versus average in different elements, based on wind, humidity and temperature.
If you want more details on many of the calculations, check out the Adjusted Quarterback Efficiency (AQE) primers from last season.
Archive of past AQE posts, including my analysis of who deserved the 2023 MVP leveraging this metric
YTD 2024 ADJUSTED EFFICIENCY RESULTS
First, here’s the chart for sack adjustments, with particular note that my model estimates holding onto the ball too long (i.e quarterback) is responsible for most of sack rate over expected, and time-to-pressure (i.e. blocking) a lower amount. Sacks are a (mostly) quarterback stat.
The next plot below shows each quarterback who has been involved in 250 plays this season (dropbacks plus designed runs). There are two points for each quarterback: 1) The team-colored dot for the actual EPA per play the quarterback has this season and 2) The quarterback headshot representing the adjusted quarterback efficiency (EPA/play). There is also a team-colored line linking the two on each row.
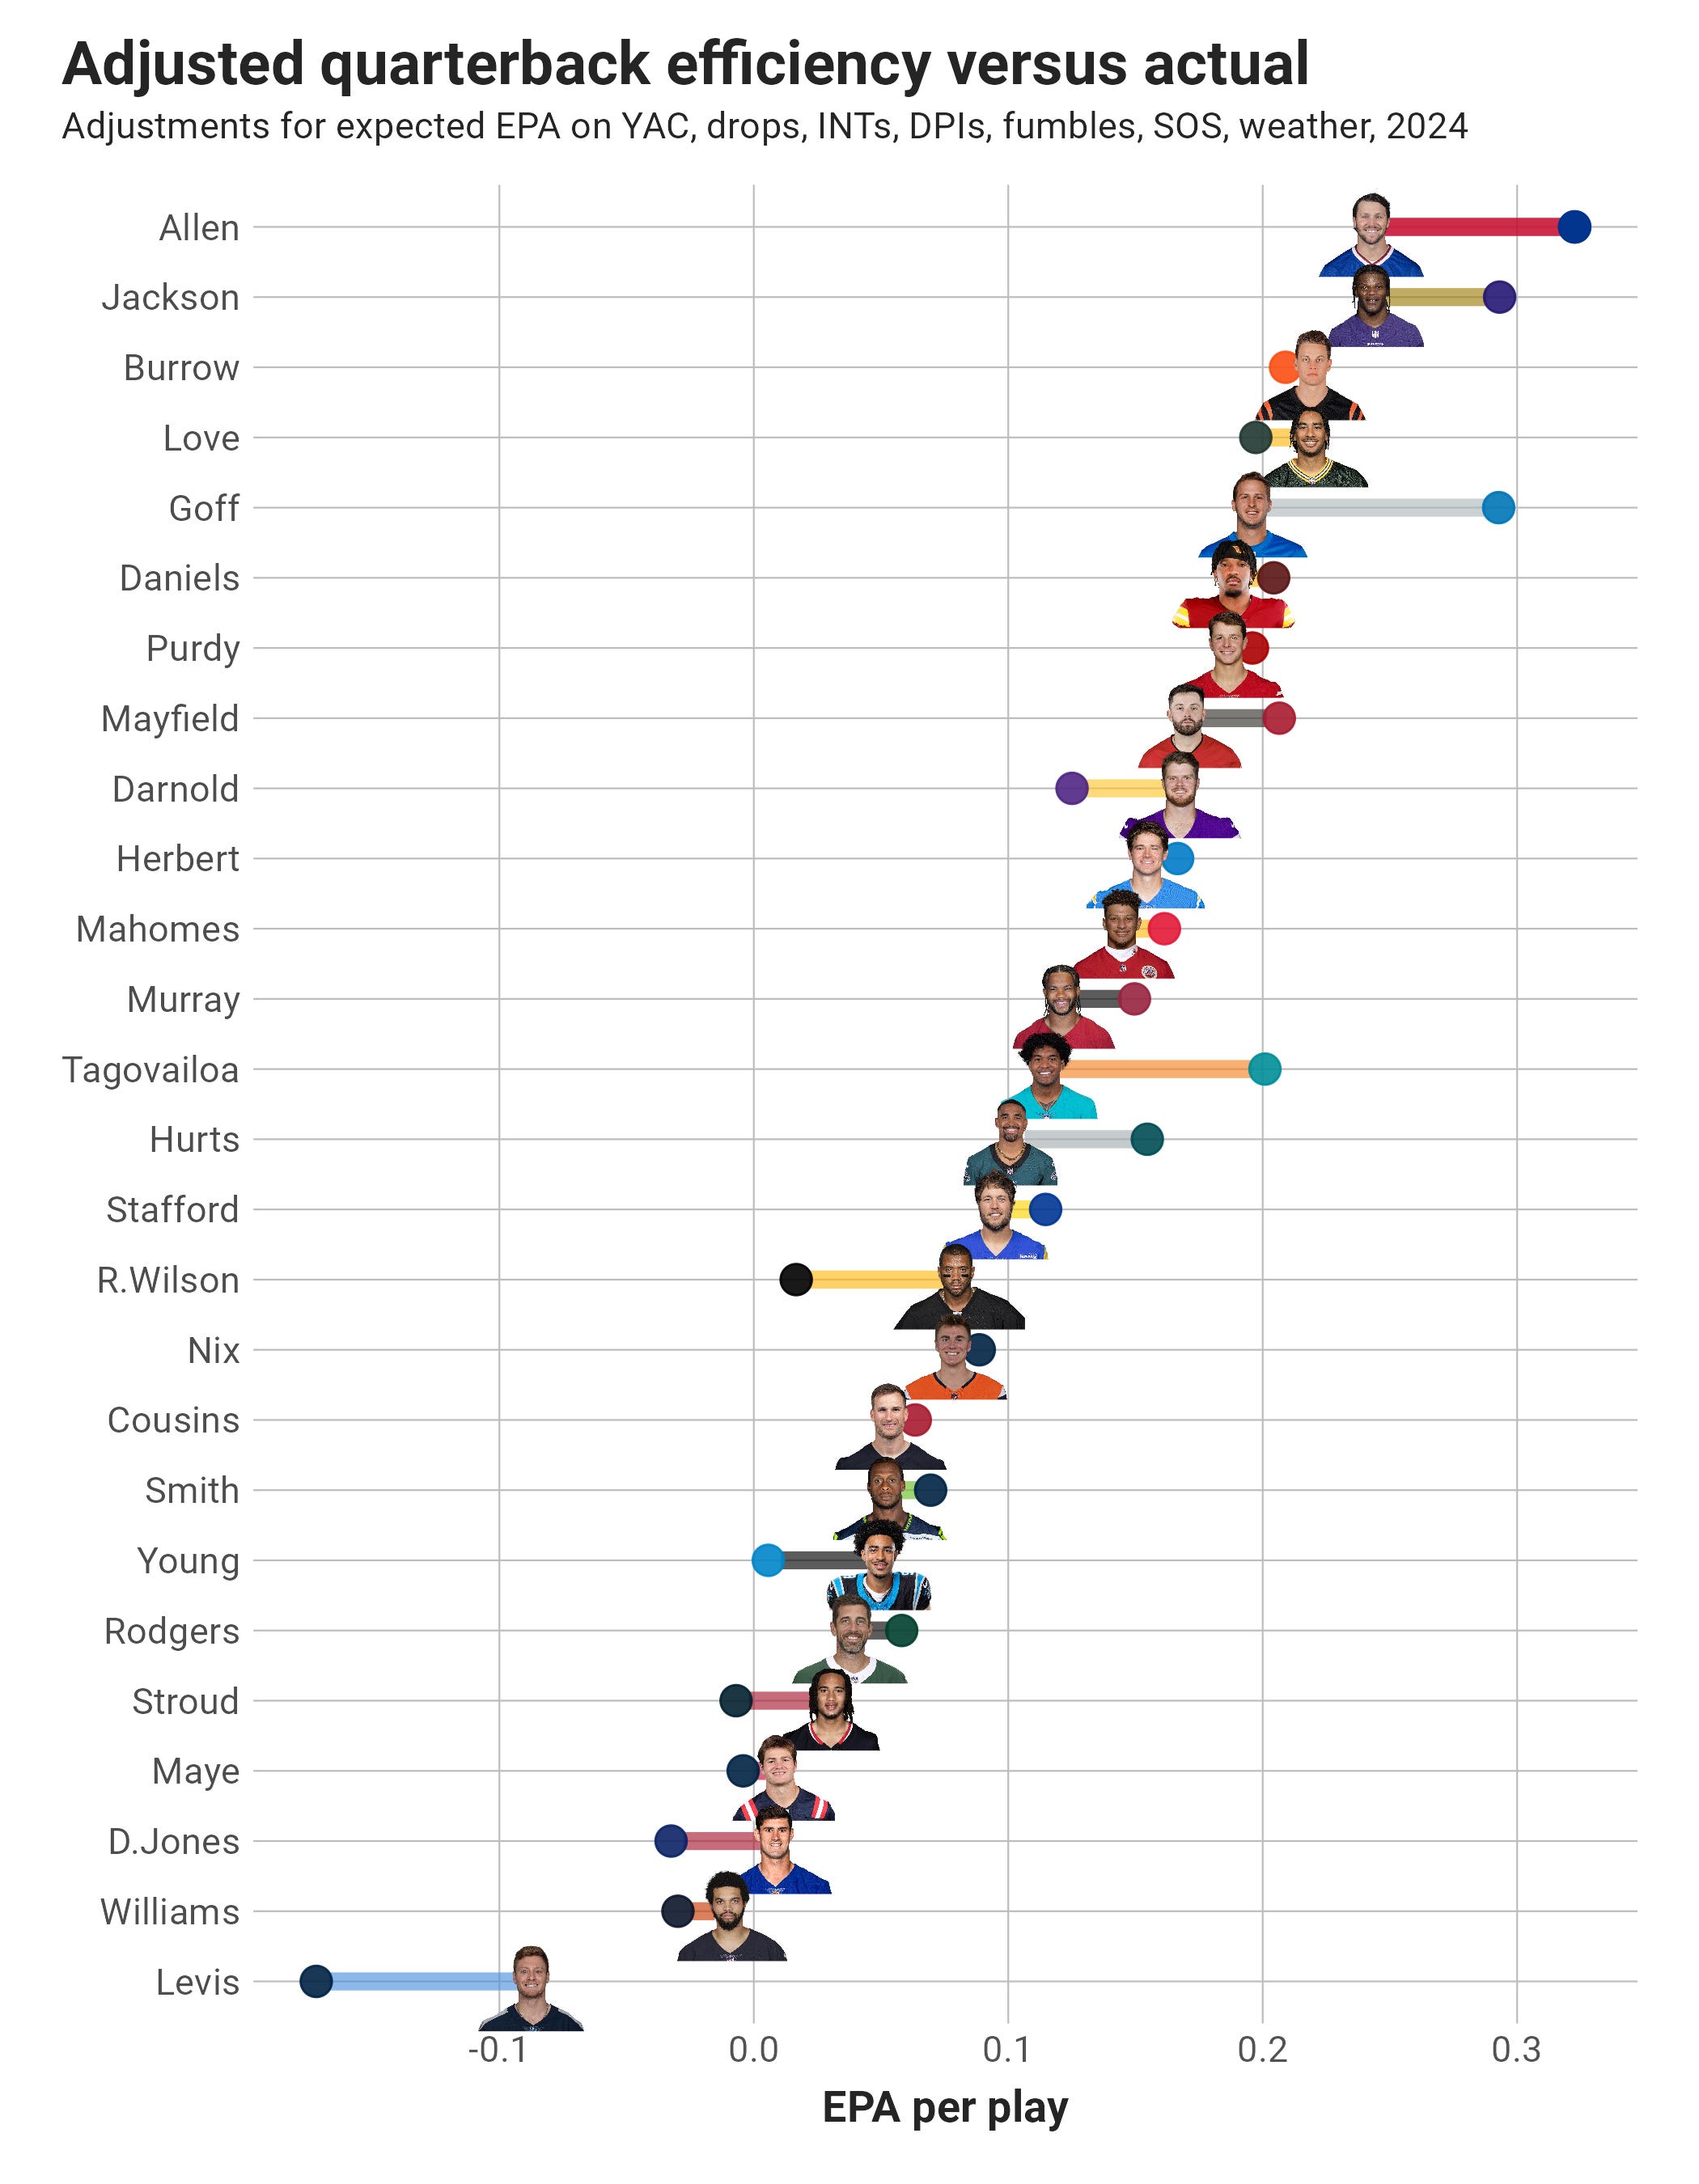
In the final regular season results, it remains Josh Allen and Lamar Jackson at the top of AQE, with Joe Burrow and Jordan Love in the next tier. This year, AQE isn’t going to provide us with overwhelming evidence of who is deserving (or should be disqualified) from being MVP - but it did narrow our field to two candidates.
I do think we would have had to entertain Burrow or Love as MVP if the former made the playoffs and the latter didn’t miss substantial play time. Re. Burrow: #QBWinz isn't a primary driver, but there are some weaker signals there. In Burrow’s case, his underperformance in wins coincided with vast underperformance versus Allen and Jackson in unadjusted EPA efficiency, i.e. the actual results on the field.
Now that we know there should be two candidates, and those two candidates are separated in AQE by 0.0004 adjusted EPA per play, where do we go? I’m going to bring in some other factors, assess their relevance to the analysis, and come away with the most satisfactory answer - an answer that still might not be satisfying.
Since AQE numbers are a virtual tie, I’ll next proceed to actual EPA per play. Yes, I think AQE is a better measure of quarterback play than unadjusted efficiency. That said, we can’t be certain our adjustments are perfectly calibrated, so falling back to the actual point-value added by quarterbacks on their play involvements (dropbacks and QB designed runs) is the foundational measure of value. Unfortunately, actual efficiency doesn’t provide much more differentiation between Allen and Jackson than AQE, with Allen leading by 0.03 EPA per play. If we end the analysis here, the award should go to Allen by basically a weighted coin flip.
The next step I like to look at is how good the quarterbacks’ offenses were generally. Excluding the Buffalo Bills’ Week 18 game where Allen played one snap and didn’t have a play involvement, the Bills’ overall offensive efficiency was slightly better than the Baltimore Ravens’ (+0.205 to +0.197 EPA per play), with the teams ranking first and second in the NFL.
A lot has been made of Jackson’s ultra-low interceptions total (4), but the Ravens overall had more turnovers, and Jackson himself was credited with six of the Ravens’ seven lost fumbles. Some of those should be fully credited to him, like miscommunications on handoffs or those dropped by the running back. As a policy, I only give the quarterback one-third of the negative EPA on fumbles lost labeled as “Aborted” in the play description. Jackson had two of those aborted fumbles, and four others on him. Allen had two fumbles lost.
The Ravens averaged more yards per play and ran 93 more offensive plays, which factors into the stat graphics you see with Jackson leading Allen in both passing and rushing yardage totals. The Ravens accumulated 1,119 more offensive yards this season, but scored seven fewer points than the Bills. The Bills simply had the ball less often, with the Ravens’ playing at a faster pace.
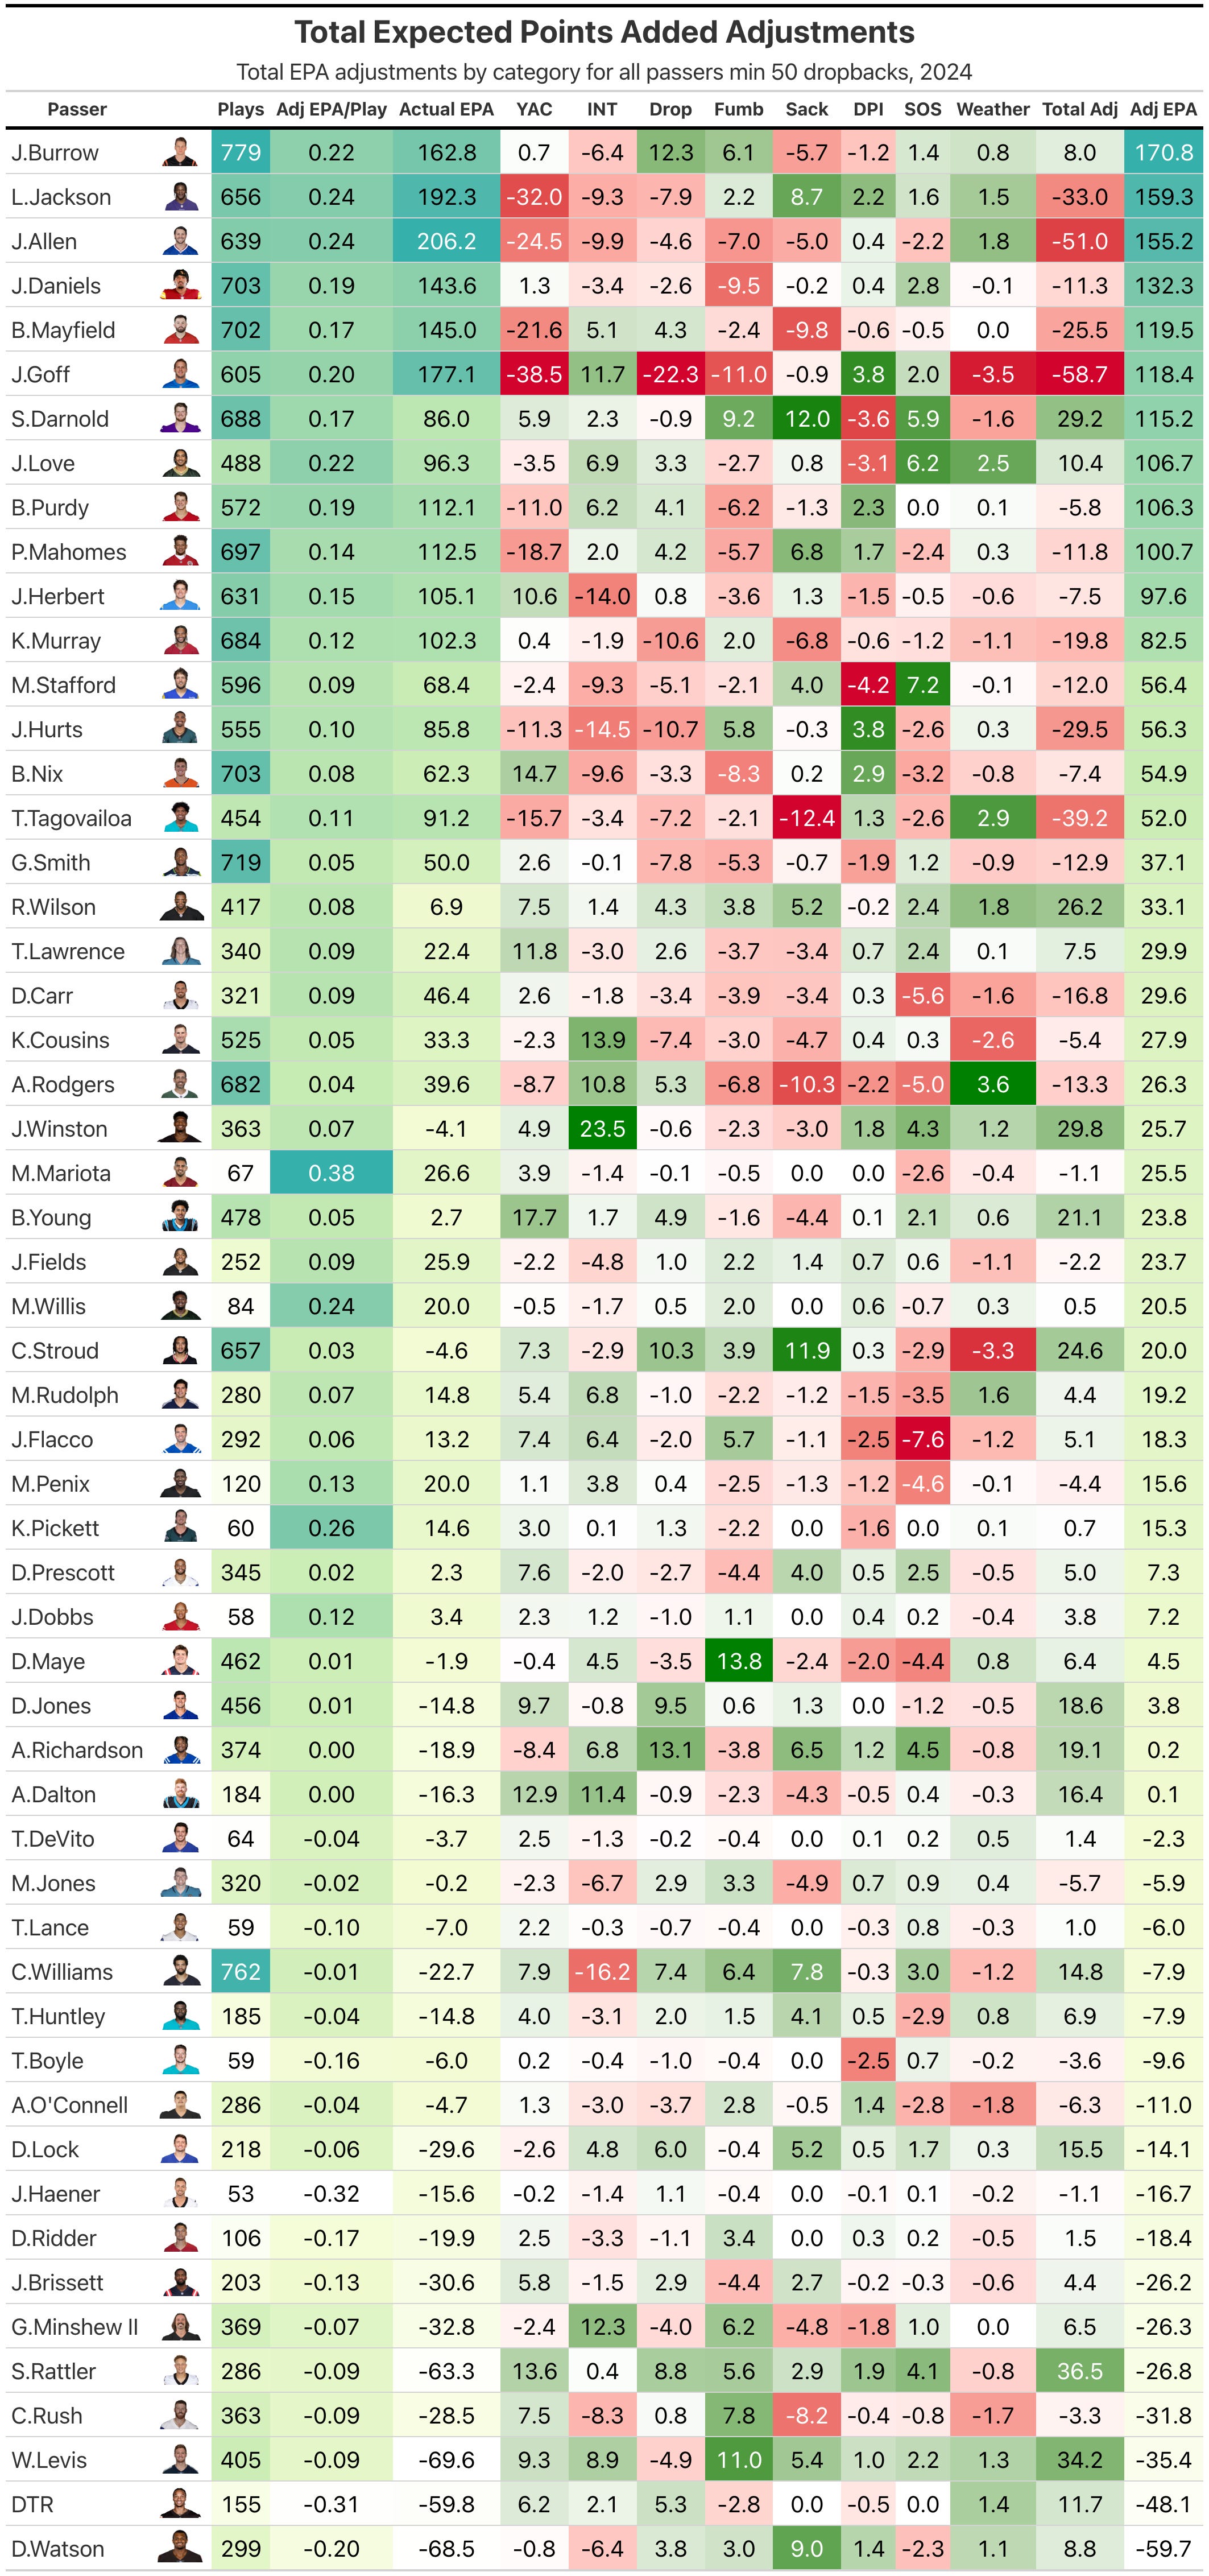
Next, let’s look at how reliant the quarterbacks’ respective offenses were on their play-involvement production. The Bills accumulated +205.1 total EPA in Weeks 1-17 and the Ravens at +215.2 for the entire season. Allen’s total unadjusted EPA was +206.2, and Jackson’s was +201.3. Jackson has more total adjusted EPA (see below), but still less on the per-game basis.
It’s a bit difficult to assess the real contribution of quarterbacks to offenses this way, mostly because the average rushing play is negative. A simpler way to measure reliance would be to come up with the quarterbacks’ play involvement totals as a percentage of total team plays. Allen had 639 play involvements on 998 team plays to Jackson’s 656 involvements on 1,091 plays: that’s 64.0% to 60.1%. Once again, this measure gives a slight lean to Allen.
What about the concept of “garbage time” production? I tend to discount the concept, as teams mostly play hard to win until at least the fourth quarter and one side has a nearly overwhelming lead. If you use strict filters and eliminate only plays in the fourth quarter with the win probability for one side over 98%, Allen’s EPA per play lead widens slightly, and his total play involvement deficit narrows, meaning Jackson has played a little more in “garbage time” than Allen.
Lastly, I’ll discuss team records. This measure, for me, should be no more than a tiebreaker. The signal here is low, but it’s not nothing. If there is potentially something missing in advanced metrics it would be the inability to directly translate points-based metrics like EPA directly into the effect on the ultimate goal: winning the game. Again, this measure leans ever so slightly to Allen, finishing 13-4 to the Jackson at 12-5, with the Bills taking a Week 18 loss to the previously worst team in the NFL in a meaningless matchup.
Splitting win-loss stats further, into stuff like matchup against playoff teams or head-to-head makes no sense to me. In a head-to-head matchup, the quarterbacks aren’t lining up against each other. It’s two quarterbacks facing different defenses just like every other week of the season. There’s also no reason to give more credit for beating good teams, while not docking someone as much for losing to poor teams. The ultimate goal is total wins, which requires beating good teams and poor alike.
JOSH ALLEN SHOULD BE THE 2024 NFL MVP
It’s not going to come as a surprise to you that my lean overall is slightly towards Josh Allen as MVP. The case can be made for Lamar Jackson based on PFF grades or how much he helps the rest of the rushing attack (which I analyzed last year). But for me, those factors are close enough between Jackson and Allen to only mitigate, not reverse the advantages built up for Allen with other metrics.
For what it’s worth, fellow nerd Ben Baldwin has an adjusted EPA measure that has Allen materially above Jackson (+0.04), though below Joe Burrow and Jayden Daniels. I like my measure’s calibration overall, but Baldwin’s does give some confirmation of the idea that Allen has been more valuable than Jackson.
No matter who wins this year, it won’t be a case of “voter fatigue” or any significant bias for Allen or Jackson. Both are deserving, unlike last year, when Jackson won in a crowd with no clear MVP-worthy campaigns.
Not related to this post but do you plan on doing updates to the all time QB rankings ever? I'm sure this wouldn't be easy but would be cool to see it as a live standings page to see how active players move up and down.
Do you know what the primary differences between your adjustments and Ben’s are? Picking two qbs with some of the larger adjustments an example.
In his model Goff and Lawrence get adjusted to basically the same EPA per play but here they are still pretty far apart.
Directionally you both adjusted them the same but was much larger in magnitude.
Just curious since it seems like you are both adjusting for similar things.