


The adjusted scores quantify team play quality, with emphasis on stable metrics (success rate) and downplaying higher variance events (turnovers, special team, penalties, fumble luck, etc). Adjusted expected points added (EPA), in conjunction with opportunity-based metrics like total plays and drives, projects adjusted points. Adjusted scores have been tested against actual scores and offer slightly better predictive ability, though their primary benefit is explanatory.
All 2026-2022 and historical Adjusted Scores and other site metrics are available in a downloadable format to paid subscribers via Google Sheet.
Find previous advanced reviews here
Unexpected Points is a reader-supported publication. To receive new posts and support my work, consider becoming a free or paid subscriber.
** Adjusted Scores table:
“Pass” - Pass rate over expectation (based on context of each play and historical averages
“Success” - Success rate on offense, a key metric in adjusted score vs actual
“H & A” - Home or away team
49ers (-7.5, 76%) vs Commanders

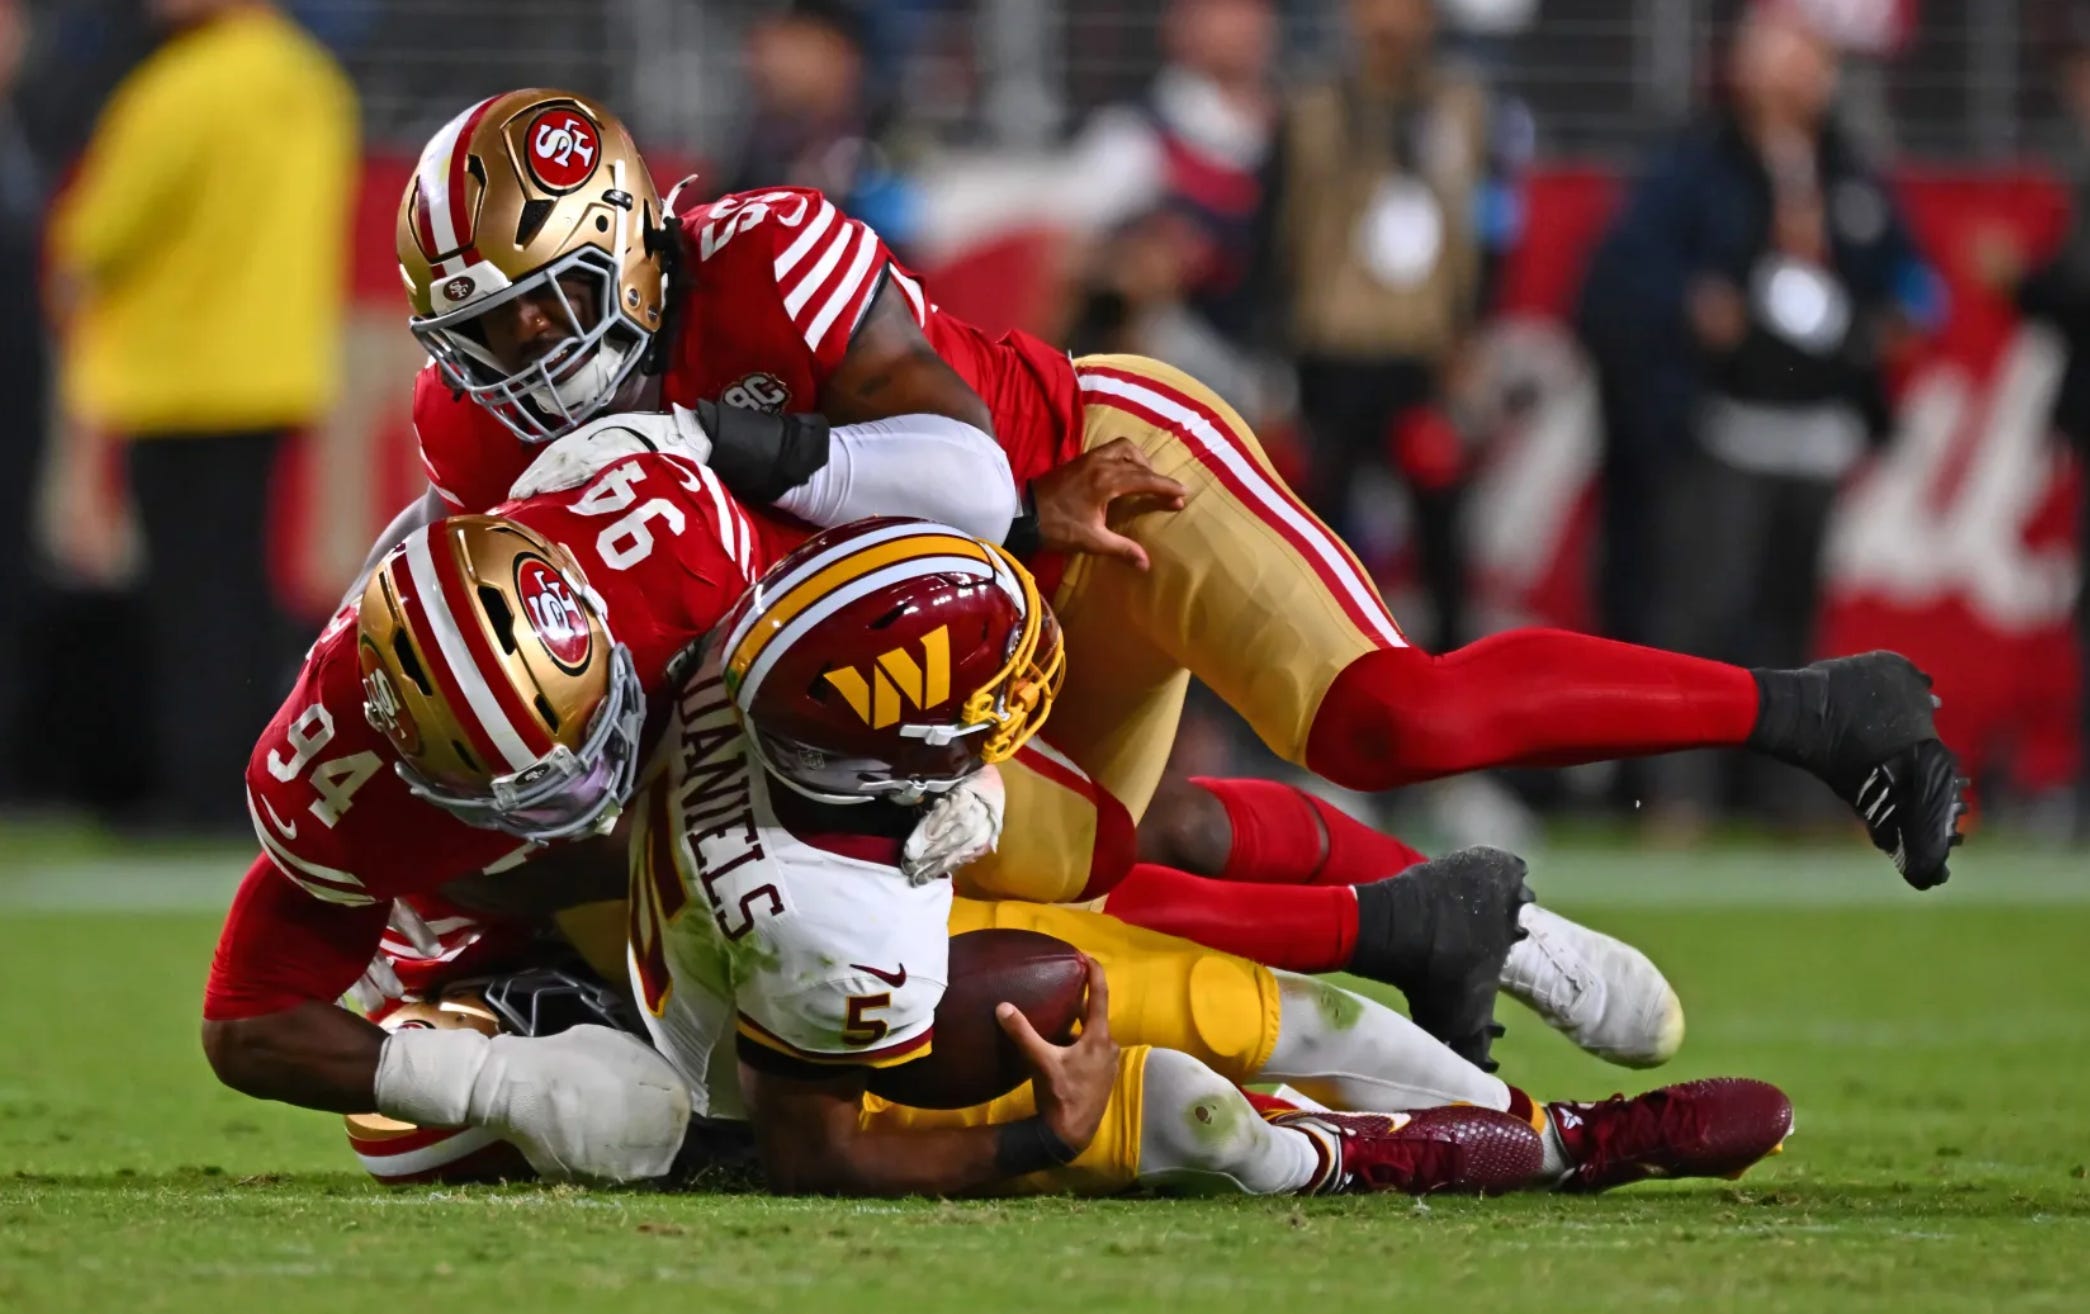
The San Francisco 49ers held on to win at home against the Washington Commanders, a result that enhances the idea that they aren’t as strong as their perfect 6-0 record. The adjusted scores had them as the better team, but only by four points. The 49ers offense was moribund down the stretch, going 3-and-out on their final three possessions, opening the door for the Commanders multiple times.
While I didn’t write it on the initial Tuesday release of the Week 6 Power Rankings, the Commanders did become a play by the end of the week, with the Sunday update placing them at a 27.7% win probability in the model versus 22% in the market. Unfortunately you can’t win them all, and this was one of five 5%+ advantages that didn’t pay off, though there was some hope when the Commanders drove into the red zone with a few minutes remaining down six points.
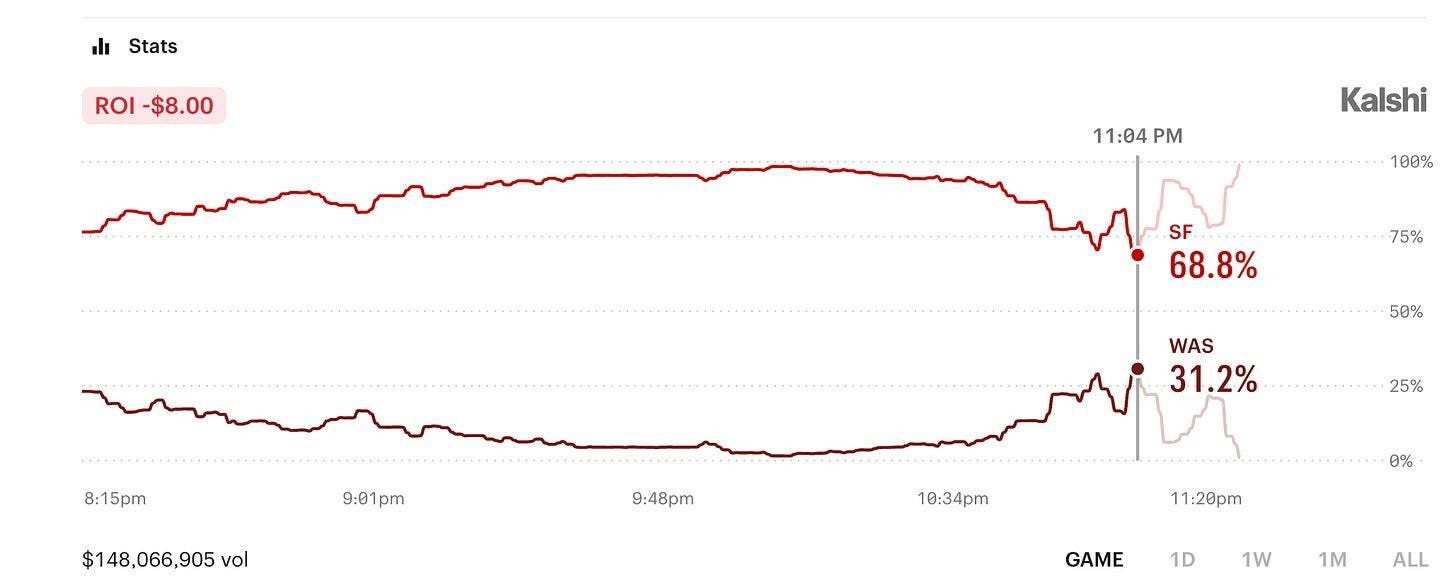
But the reality is that the game never got that close in prediction market win probability, with the Commanders peaking at 31.2% on that drive. This is in contrast to the nflfastR win probability model that only had them as high as 27.3% (down six points with 2:26 left, 2nd & 3 at the SF 17). Modeled win probabilities tend to overvalue the leading team in these situations versus the market, especially if they’re substantial favorites going into the game.
