


You can find all the previous editions of the Bayesian Quarterback Rankings here, and the backlog for Adjusted Quarterback Efficiency is here.

GO-FORWARD PROJECTED ADJUSTED EFFICIENCY
This update includes a pretty big re-work of the methodology, which projects more useful EPA per game numbers, along with details on exactly how those projections have moved from the prior week and through the season.
Additions to this update include:
Removing the YAC and sack adjustments from the adjusted EPA data going into the model, with testing confirming those are less “luck”-based than contextual information that enhances projection accuracy.
Giving additional weight to “breakout” seasons (those occurring in years 2-4 that are +0.1 adjusted EPA higher than any previous season) to mitigate poor prior performance that’s less predictive.
Establishing a “starter” designation that raises their draft prior to match franchise quarterbacks taken in that range, not backups filling in. The starter designation is phased in over the first 1,000 career snaps.
“Stretching” (or shrinking) the projections to match the current EPA efficiency environment. We’ve been in a phase of enhanced efficiency since roughly the quarter-point of the 2025 season.
Capping older season results at +/- 1.5 standard deviations to smooth outlier effects that are less meaningful to today’s projections.
Lowering the weight of prior-team results to roughly 50% of current-team results.
These changes were all made through the iterative process of extensively testing ideas and measures at different levels and choosing the parameters that ended up with the most predictive power.
These rankings are for the go-forward projections of adjusted quarterback efficiency as of this week. They do not account for opponent strength or injuries to supporting cast, both of which go into the weekly Power Rankings.

Speaking of power rankings, this update to the Bayesian rankings and projections has been highly useful in determining quarterback adjustments when a team’s starter changes due to injury or benching.
In the tables below, I also included the adjusted EPA per play rankings for each quarterback over 2026 (min 100 play involvements) and the prior nine seasons (minimum 300 plays) so you can see the evidence going into the projections.
Older data is decayed over time, so the 2026 and 2025 EPA per play data matters more than data from prior years. That said, older data can’t be fully discounted, or else you miss bounce-back performances by great quarterbacks, like Aaron Rodgers returning to form after a few poor statistical seasons and winning his third and fourth MVPs in 2020 and 2021.
For this analysis, I’m including those quarterbacks who might be out in Week 10 but should eventually be returning as starters, such as Sam Darnold (he won’t be benched, right?) and Malik Willis. The trade deadline and injuries shifted some starters around, reflected in this update.
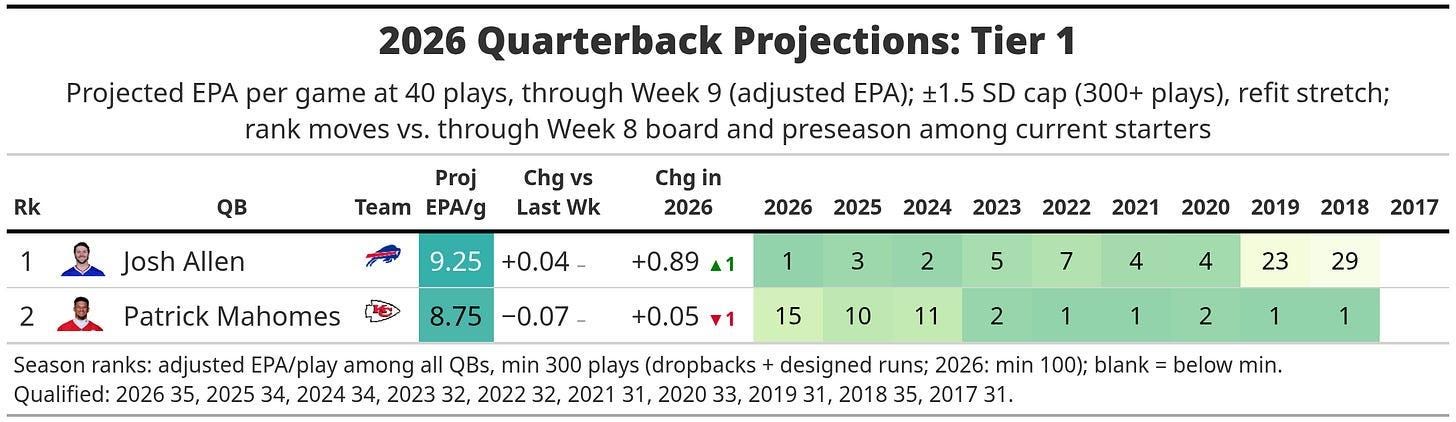
The incremental shifts in the top-2 continue, with Josh Allen extending his lead over Patrick Mahomes. With Mahomes stagnant in a season with many elite quarterbacks having outstanding efficiency performances, he’s falling towards the larger second tier of quarterbacks, though he still has a ways to go.
Excluding the negative adjustments for receiver YAC and strong pass blocking, Allen is first overall this season in adjusted EPA per play.
