Introducing the QB GOAT Series
My methodology for valuing the greatest quarterbacks of all time, highlighting a few honorable mentioins
Like my NFL Plus/Minus metric, this is more of a re-introduction than initial exercise, but the first time in written form. I did a podcast series last summer going through my best estimates for the top-50 statistical quarterbacks of the NFL modern era, which for me goes back to 1947, a year after the league was reintegrated.
I’ve refreshed and improved the methodology this offseason, and this is the first of a series of posts with visualizations and context around the quarterbacks who scored in the top-50, with some space today for those barely missing the cut, plus one who wasn’t, at all, close but is more likely than not to make the Hall of Fame.
METHODOLOGY
I don’t want to get too bogged down in the details, but it’s critical when ranking anything, especially when there will be clear contention, to be as explicit as reasonably possible. The foundation of the analysis is efficiency over league-average adjusted for era.
For passing, I use adjusted net yards per attempt (ANY/A), as it’s explicit formula accounts for the impacts of per-pass yardage, touchdowns, interception and sacks. It’s not as accurate as expected points added to the precise play-level effect on scoring, but we have the components going back much further for ANY/A, which is necessary to compare recent results from those decades past.
I also weigh rushing efficiency in the equation, in a similar formula to ANY/A, but using yards per carry, with the same 20-yard bonus for touchdowns and 45-yard deduction for turnovers (fumbles).
The passing and rushing efficiency number for each quarterback season is measured against the five-year rolling averages of that era, and then translated into a Z-score, or standard deviations over/under the league average.
I weigh volume by applying a multiple to each standard deviation gained/lost that is the ratio of quarterback passes/rushes that season versus the per-team league average. The league average number is discounted by 5% to account for the fact that starting quarterbacks often miss some time. In other words, if a quarterback produces ANY/A a standard deviation higher than the league in a year, but passes a a volume 20% higher than average, his seasonal standard deviation gained will be 1.2.
The playoff value contributions are calculated in the same manner, but the games are more highly weighed due to the relative importance of results on the ultimate goal, winning a championship. A full playoff run, which varies in length by NFL era, can contribute up to a half-season’s worth of value for a quarterback, a significant driver of overall QB GOAT results. I understand that team results often determine if a team makes it to the playoffs, or has a longer run to accumulate quarterback stats. This is one of many instances where simplicity must be weighed against isolating quarterback contribution, and I chose to go with the former.
The last element of the QB GOAT value calculation is an added measure for peak play, which I chose as the top-5 regular seasons of each quarterback’s career. While a steady, good career is important, quarterback who can provide a handful of truly elite seasons have the biggest impact of the potential for team success and a long playoff run.
The career, peak and playoff standard deviations gained each roughly account for a third of the QB GOAT calculation. Thanks to the generous contributions of data from other, I have sack and sack-yard numbers for many quarterback seasons before it’s available on public data sources, and used career averages or league averages for those seasons where those numbers remain missing.
Let’s get to the quarterbacks who barely missed the top-50 cut.
No. 51: DAUNTE CULPEPPER
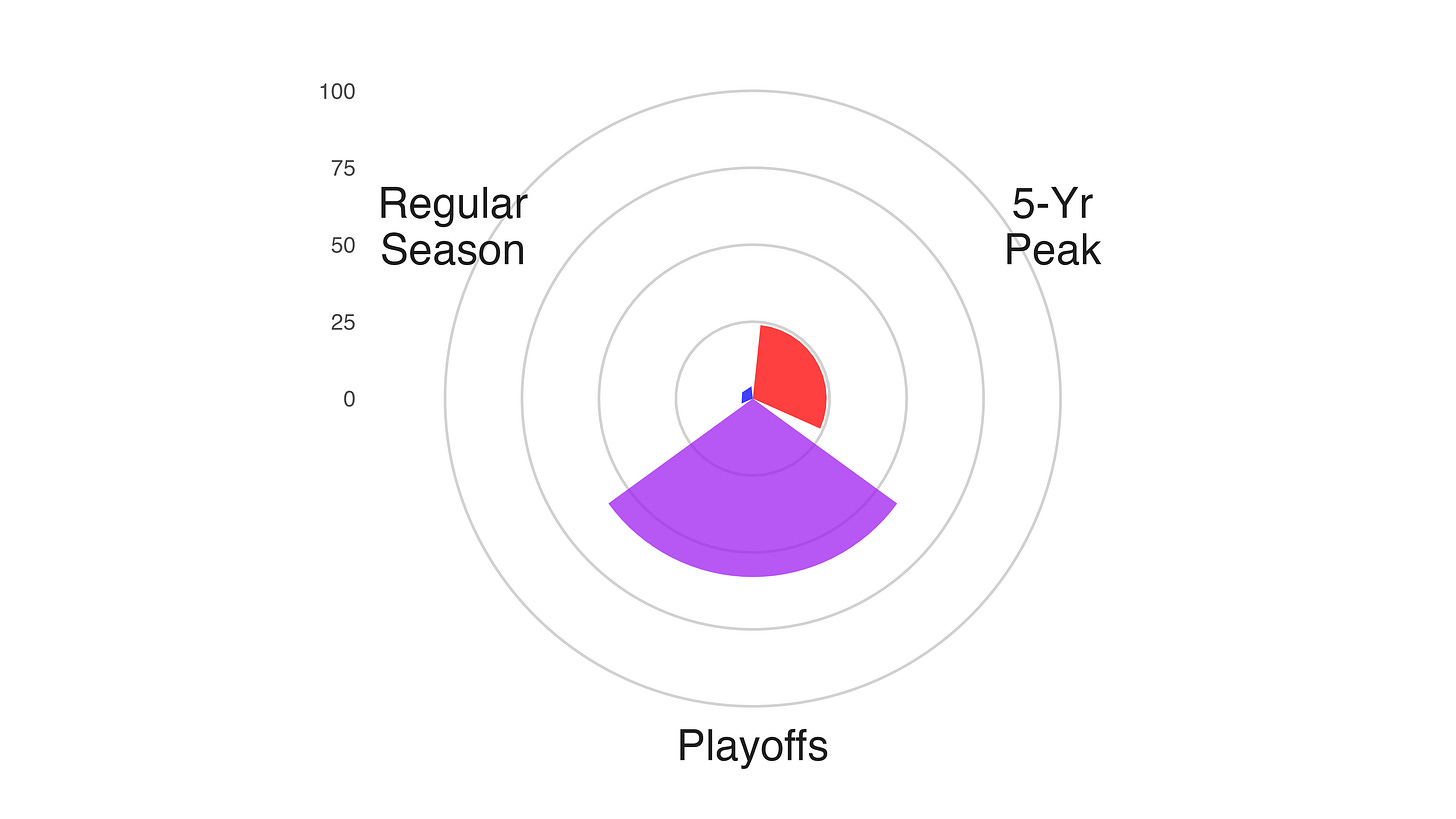
Regular: 62nd, Peak: 44th, Playoffs: 45th
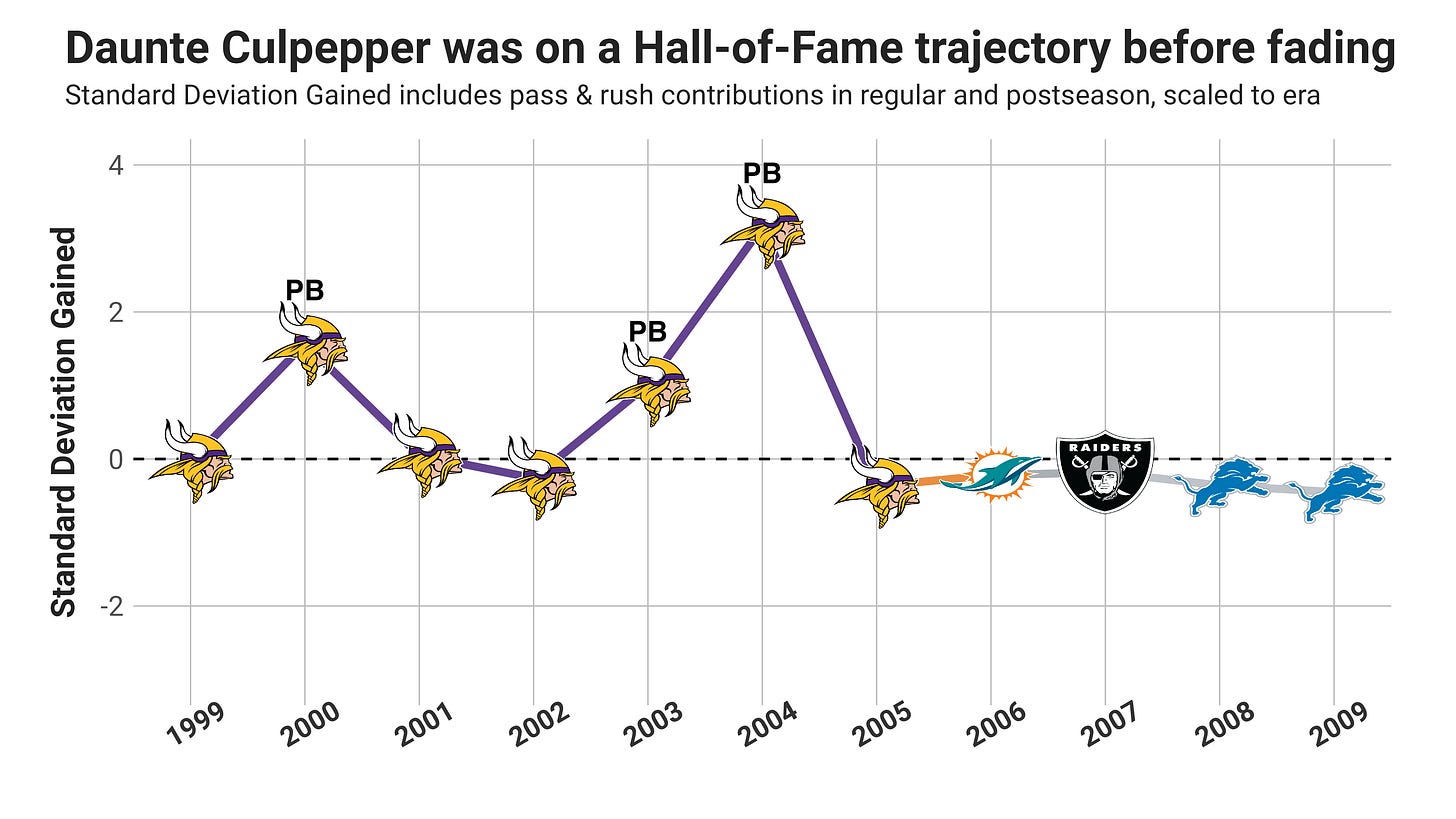
You could argue that Culpepper was on a clear Hall-of-Fame trajectory six years into his NFL career. Culpepper’s 5.5 standard deviations gained from 1999-2004 was the 15th most by any quarterback in history at that point in their careers, the only quarterbacks higher on the list who aren’t in the Hall of Fame being Russell Wilson (yes, he’ll get there) and Ken Anderson.
I try to separate supporting cast from the hard conclusions of the rankings, but it’s perfectly reasonable to question how much of Culpepper’s early success was starting his career a year after Randy Moss, who as a rookie helped Randall Cunningham produce a First-Team All-Pro season at the ripe age of 35. Evidence in Culpepper’s favor that he wasn’t completely a product of Moss is that his most efficient season in 2004 came when Moss missed multiple games and wasn’t even the team’s leading receiver. Culpepper averaged nearly 10 yards per attempt throwing 102 times to Nate Burleson, a solid but less than game-changing wideout.
Culpepper is one of the great “what if” NFL players in more ways than one. Of course, his catastrophic knee injury in the seventh game of the 2005 season changed the course of his career. Culpepper damaged the ACL, MCL and PCL and never again hit above-average efficiency passing, and only gained 176 of his career 2,652 rushing yards thereafter.
Even if Culpepper maintained his heath, you have to wonder if his unique dual-threat ability could be fully realized in his era. Many have compared the 2023 combine-smashing performance of Anthony Richardson to Cam Newton, but Culpepper might be the better comparison. Culpepper ran the forty less than a tenth of a second slower than Richardson (4.52), but weighing 11 pounds more (255). He also posted similar marks in the vertical (39” to 40.5”) and broad jumps (10’2” to 10’9”).
Culpepper was certainly given the opportunity to use his legs in the Vikings offense, but averaging under 500 yards and roughly five touchdowns per starting season isn’t the eye-popping numbers you’d expect from a similar talent in today’s NFL.
Culpepper swift and sustained decline post-2004 lowers his career regular season percentile well under 50th, but he did outperform with peak play and in four playoffs games over two post-season appearances in 2000 and 2004. The fact that Culpepper’s peak ranking is strong while only having three positive value seasons speaks to how crazy good his 2004 really was. It was the 15th most valuable regular season in the modern NFL, as Culpepper posted 8.0 ANY/A while leading the NFL in passing yards and completions. In fact, Culpepper broke Dan Marino’s record for most combined passing and rushing yards, generated 5,123 total yards, still a top-20 number after 20 years of league-wide offensive expansion.
No. 52: DAK PRESCOTT
Regular: 45th, Peak: 60th, Playoffs: 39th
Prescott has added value every year of his NFL career, with spikes in 2016 and 2019. He was a phenom as an unexpected fourth-round rookie starter, subbing in for the injured Tony Romo1 and never looking back. Prescott was awarded Offensive Rookie of the Year, made the Pro Bowl and was even received an MVP vote. Prescott probably should have gotten more MVP consideration, but fellow Cowboys rookie Ezekiel Elliott got even more credit (six votes) for their 12-4 season. I think we’ve learned now that Prescott was always the straw that stirred the drink in Dallas.
Though it came with no accolades, 2019 was arguably Prescott best individual season, largely overlooked as the Cowboys went 8-8 and missed the playoffs. Fundamentally, the Cowboys were better than their record, going 0-5 in one-score games. Prescott’s 7.8 ANY/A was third to only Patrick Mahomes and unanimous MVP Lamar Jackson among quarterbacks who started at least 12 games. Prescott started 2020 in a very similar fashion, posting 7.7 ANY/A in five games before suffering a season-ending injury. Again, the Cowboys mediocre team record (2-3) masked Prescott’s passing evolution, for the first time passing with great efficiency at high volume, averaging 321 passing yards per game in 2019 and 2020, nearly a 100-yard increase from his previous career number (226).
Prescott’s worst regular season value contribution came last year, but boosted by a particularly strong Wild Card performance against the Tampa Bay Buccaneers. His passing efficiency was slightly better than the sophomore slump low in 2017 (6.0 ANY/A to 5.7), but he no longer contributes many high-value runs near the end zone. Prescott averaged six rushing touchdowns per season his first three years, but only two combined post-2020 injury.
Looking at the three major drivers of the QB GOAT value calculation, Prescott is a bit weaker for his five-year peak than the other categories, but still has plenty of time in his career to improve on all three metrics.
Prescott is almost certain to get into the QB GOAT top-50 over the next few years, barring a drop in play and multiple seasons playing below-average in efficiency, which hasn’t happened once so far in his career. What he really needs to solidify his status as a Hall-of-Fame contender are a couple more spike seasons, and a long playoff run.
A big part of the disconnect between my valuations and common perception is probably how Prescott is viewed as a playoff performer. By simple #QBWINZ, the Cowboys are 2-4 in the six playoff games he’s started. Yet the quarterback hasn’t been the issue, with Prescott averaging a healthy 7.2 yards per attempt over 216 passes, throwing 11 touchdowns to only four interceptions. Prescott was also a key contributor on the ground, scoring four touchdowns on 25 attempts without a lost fumble.
All four of the Cowboys’ playoff losses with Prescott have been by less than a single possession (3, 6, 7 and 8 points). After a shootout loss to the Packers in Prescott’s rookie season (34-31), the ground game has failed the Cowboys more than Prescott. In the Cowboy’s last four playoffs games (includes three losses), Ezekiel Elliott hasn’t broken 3 yards per carry once, totaling 131 yards on 55 carries.
The perception of Prescott a good-but-not-elite quarterback is probably best illustrated in his relatively low five-year peak play versus his steady accumulation of value. There will likely be more spikes down the road, yet the Cowboys will have a tougher time building around his outsized contract and adding explosive talent to maximize his throwing efficiency.
No. 53: KIRK COUSINS
Regular: 49th, Peak: 42nd, Playoffs: 67th
Trust me, I don’t want to see Cousins sitting on the precipice of the top-50, but it’s hard to deny his steady production. The then Redskins drafted Cousins in the fourth round the same offseason they mortgaged the future to take Robert Griffen III No. 2 overall. Cousins made four total starts in 2012 and 2013, then five more in 2014 before taking over at the full-time starter in 2015.
In Cousins’ nine full seasons as a starter, he’s had above average efficiency every year, only missed a single game of a possible 131, and even that wasn’t due to injury. That’s the recipe for career value added, even if not done in the most inspiring fashion. But listen, I don’t want to completely discount want Cousins has done on the field, which is consistently give his team a good chance to win, while needing a little help. For context, Cousins’ career ANY/A of 6.86 is exactly the same as Super Bowl winner and likely Hall-of-Famer Russell Wilson, playing in the same exact era of the NFL.
Cousins’ circular bar plot looks as we’d expect, with a bit better peak performance than perception. The element of the three that most matches perception is Cousins’ underperformance in the playoffs, even then only based on a four-game sample.
Cousins’ ANY/A is a full yard lower in the playoffs (5.8), two of his three starting losses came in games where he averaged more than 7 yards per attempt, including an incredibly solid performance losing to the Giants at home last season. Cousins may not have been spectacular, but teams normally win if their quarterback averages 7 yards per attempt, have three total touchdowns, no turnovers, and take zero sacks. Cousins’ very on-brand checkdown on 4th & 8 will stick in everyone’s mind, but everything he did before that should have enable the team to avoid that do-or-die situation.
I have a feeling the general appreciation for Cousins will rise as the years pass, especially if he eventually leaves Minnesota and continues to produce solid results. Cousins isn’t the dream quarterback, but you could do a whole lot worse settling.
No. 54: STEVE MCNAIR
Regular: 39th, Peak: 54th, Playoffs: 83rd
McNair is one of only a handful of quarterbacks to win MVP and not make the top-50 QB GOAT (Cam Newton being a recent example, falling to No. 89 after a few ugly seasons). McNair was a celebrated prospect, with the then Houston Oilers making him the 3rd overall pick, despite playing for the Division 1-AA (now FCS) Alcorn State. McNair had a full scholarship to play for the University of Florida, but only as a running back. In McNair final collegiate season, his offense broke several all-division records, including his single-season record 5,799 total offense (passing and rushing).
McNair’s career started slowly, only starting six games his first two seasons, sitting behind Chris Chandler, then was a below-average passer (4.8 ANY/A) in his first starting season. The definitive jump for McNair came all the way in his seventh season, culminating in sharing MVP honors with Peyton Manning in 2003, leading the NFL in ANY/A (7.8).
McNair’s career regular season and peak numbers would have been enough to get him into the top-50, but his Achilles heel was exposed in the playoffs. McNair had lots of opportunity to accumulate playoff value with five different trips to the postseason, but he lost standard deviation value in those performances.
Despite a decent team record of 5-5 in the postseason, including a trip to the Super Bowl, McNair only once surpassed 6.0 ANY/A in two games, and his 4.0 ANY/A career playoff efficiency is one of the lowest numbers in history for quarterbacks with at least 300 attempts.
There’s a strong argument that in today’s NFL McNair would have played much more earlier in his career, raising the floor with his outstanding rushing. This would have been enough to move him much higher in the rankings.
No. 96: ELI MANNING
Regular: 96th, Peak: 76th, Playoffs: 42nd
Sorry, Eli fans. I have to highlight his career numbers, or lack thereof. He’s very likely going to make the Hall of Fame, with perhaps the worst statistical case of any enshrined quarterback. What Manning had better than almost anyone was longevity and heath, starting 246 of a possible 268 games during his 16-season career. Manning was also a higher-volume passer, topping 520 attempts in all but one full regular season.
That high volume led to a ton of counting stats for Manning, some good, and some bad. Manning is still in the top-10 all-time passers for attempts, completions and yards. He’s also in the top-12 for interceptions, despite playing in a era of significantly lower turnovers. The only major statistical category Manning led the NFL during his career was most interceptions thrown (3x 2007, 2010, 2013).
The efficiency story isn’t all bad for Manning, as he produced a really solid stretch from 2008-2015 with mostly above-average efficiency, excluding his worst year in 2013. Six times Manning ranked in the top-15 passer by ANY/A, but only breached the top-5 once, fifth in 2011.
If you squint you can see Manning’s regular season value contribution right near the bottom of the top-100. His peak was slightly better with an outstanding 2011 and multiple other good seasons.
The playoffs, as expected, is where Manning shines, but not to the degree that some may think. The Giants had two magical Super Bowl runs, both times knocking off Tom Brady and the Patriots. In the 2007 season, the undefeated Patriots were arguably the best team ever, yet the Giants took them down in a classic performance that included the iconic helmet catch and Manning doing his part with 7.5 yards per attempt and zero turnovers.
The thing that most people ignore about Manning and the playoffs is the four one-and-done appearances that surround the two Super Bowl victories. In two of those losses, Manning played at a level that almost excluded the chance of victory (< 2.5 ANY/A), and in the other two Manning had as many turnovers as touchdowns, with the Giants offense never topping 20 points. Manning had some extremely well-timed runs of strong play, but overall his playoff efficiency was only slightly better than what he did in the regular season (6.1 ANY/A to 5.9).
We’ll see later that Romo also had a stronger career than most think.


As a huge packer fan, culpepper was a menace
This is going to be a fun series, and I'm glad you kept the methodology relatively simple. How much do you weight playoff games compared to the regular season? Kurt Warner 2008 would be a good test case.