


This analysis is my best attempt to discount and adjust various elements of quarterback efficiency and get to the number that most accurately reflects fundamental play. There are a number of elements of quarterback efficiency - which also directly affect team performance - that are more dependent on luck (variance) than skill.
I aggregated many of those luck-based elements, with additional factors like passing scheme ability to generate yards-after-catch, in my Adjusted Quarterback Efficiency (AQE) metric.
The measures that I believe are most luck-based and part of this analysis:
Interceptions: FTNData tracks “interception-worthy throws”, which I compare to actual interceptions on a play-by-play basis, and also adjust for expected interception return. Longer INT returns have a dramatic effect on the EPA, whether the quarterback’s fault or not.
Drops: I calculated the expected drop rate for throws, based on location, and compared it to actual drops and determined the EPA lost/gained.
Fumbles: Whether a fumble is recovered by the quarterback’s own team or not can turn a slightly negative play into a massive loss. I look at expectations for recovery based on different types of fumbles, and whether the quarterback himself recovers the fumble or a teammate (luckier).
Yards After Catch: A higher portion of yards after catch should be credited to receivers or scheme than to the quarterback, at least in comparison to throws where the yards gained were mostly through the air. I adjust down EPA generated on passes with a relatively high proportion of YAC.
Sacks caused/prevented by blocking and scheme: I introduced this element in 2024, using survival curve analysis that accounts for time-to-pressure, time-to-throw and contextual play elements from FTNData’s charting. Through this, I can divide sack credit/blame versus expectation into holding the ball too long (quarterback) and allowing pressure too quickly (offensive line). I back out the portions belonging to blocking.
Defensive Pass Interference: There are so many underthrown balls that turn into big DPI gains that need to be recognized as partially luck. By their very nature, DPIs are not “open” receivers; the coverage defender is close enough to affect the receiver.
Strength-of-Schedule: This is the one element that is most difficult to judge this early in the season. With a handful of games played, a great offense can have a bigger effect making the defenses they played look “bad”, and vice versa, than might be the truth. But it still matters.
Weather: Based on expected EPA gains/losses versus average in different elements, based on wind, humidity and temperature.
If you want more details on many of the calculations, check out the Adjusted Quarterback Efficiency (AQE) primers from last season.
Archive of past AQE posts, including my analysis of who deserved the 2023 MVP, the 2024 MVP and the 2025 MVP leveraging this metric
YTD 2026 ADJUSTED EFFICIENCY RESULTS
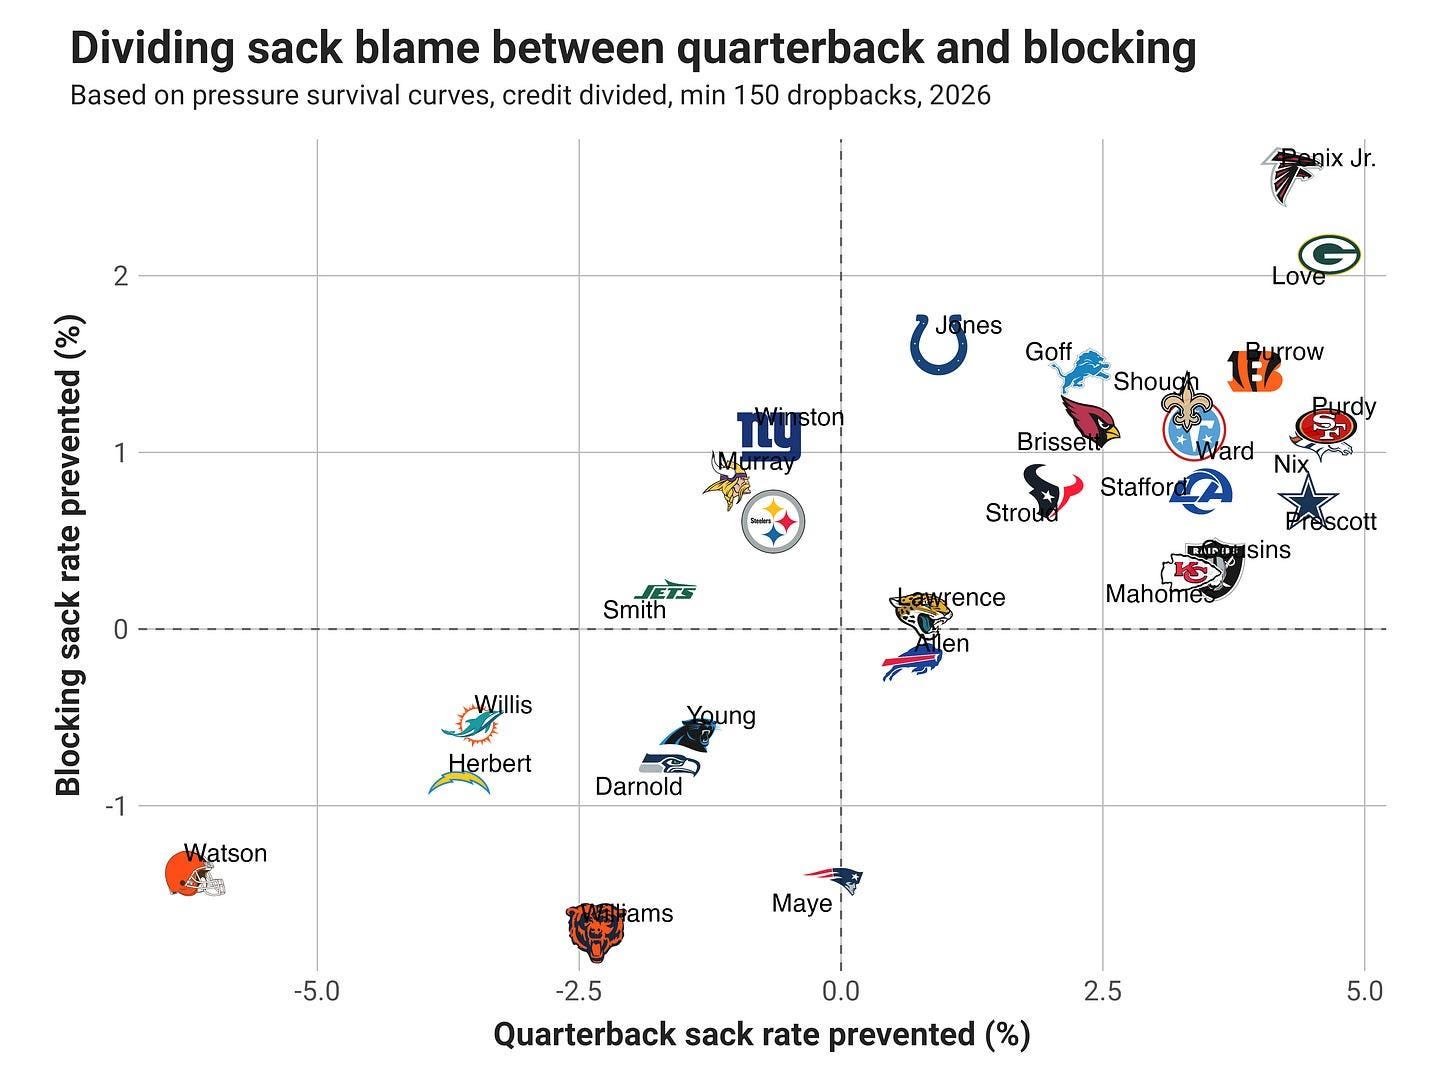
First, here’s the chart for sack adjustments, with particular note that my model estimates holding onto the ball too long (i.e., quarterback) is responsible for most of the sack rate over expected, and time-to-pressure (i.e., blocking) a lower amount. Sacks are a (mostly) quarterback stat.
The next plot below shows each quarterback who has been involved in at least 150 plays this season (dropbacks plus designed runs). There are two points for each quarterback: 1) The team-colored dot for the actual EPA per play the quarterback has this season and 2) The quarterback headshot representing the adjusted quarterback efficiency (AQE, Adjusted EPA/play). There is also a team-colored line linking the two on each row.
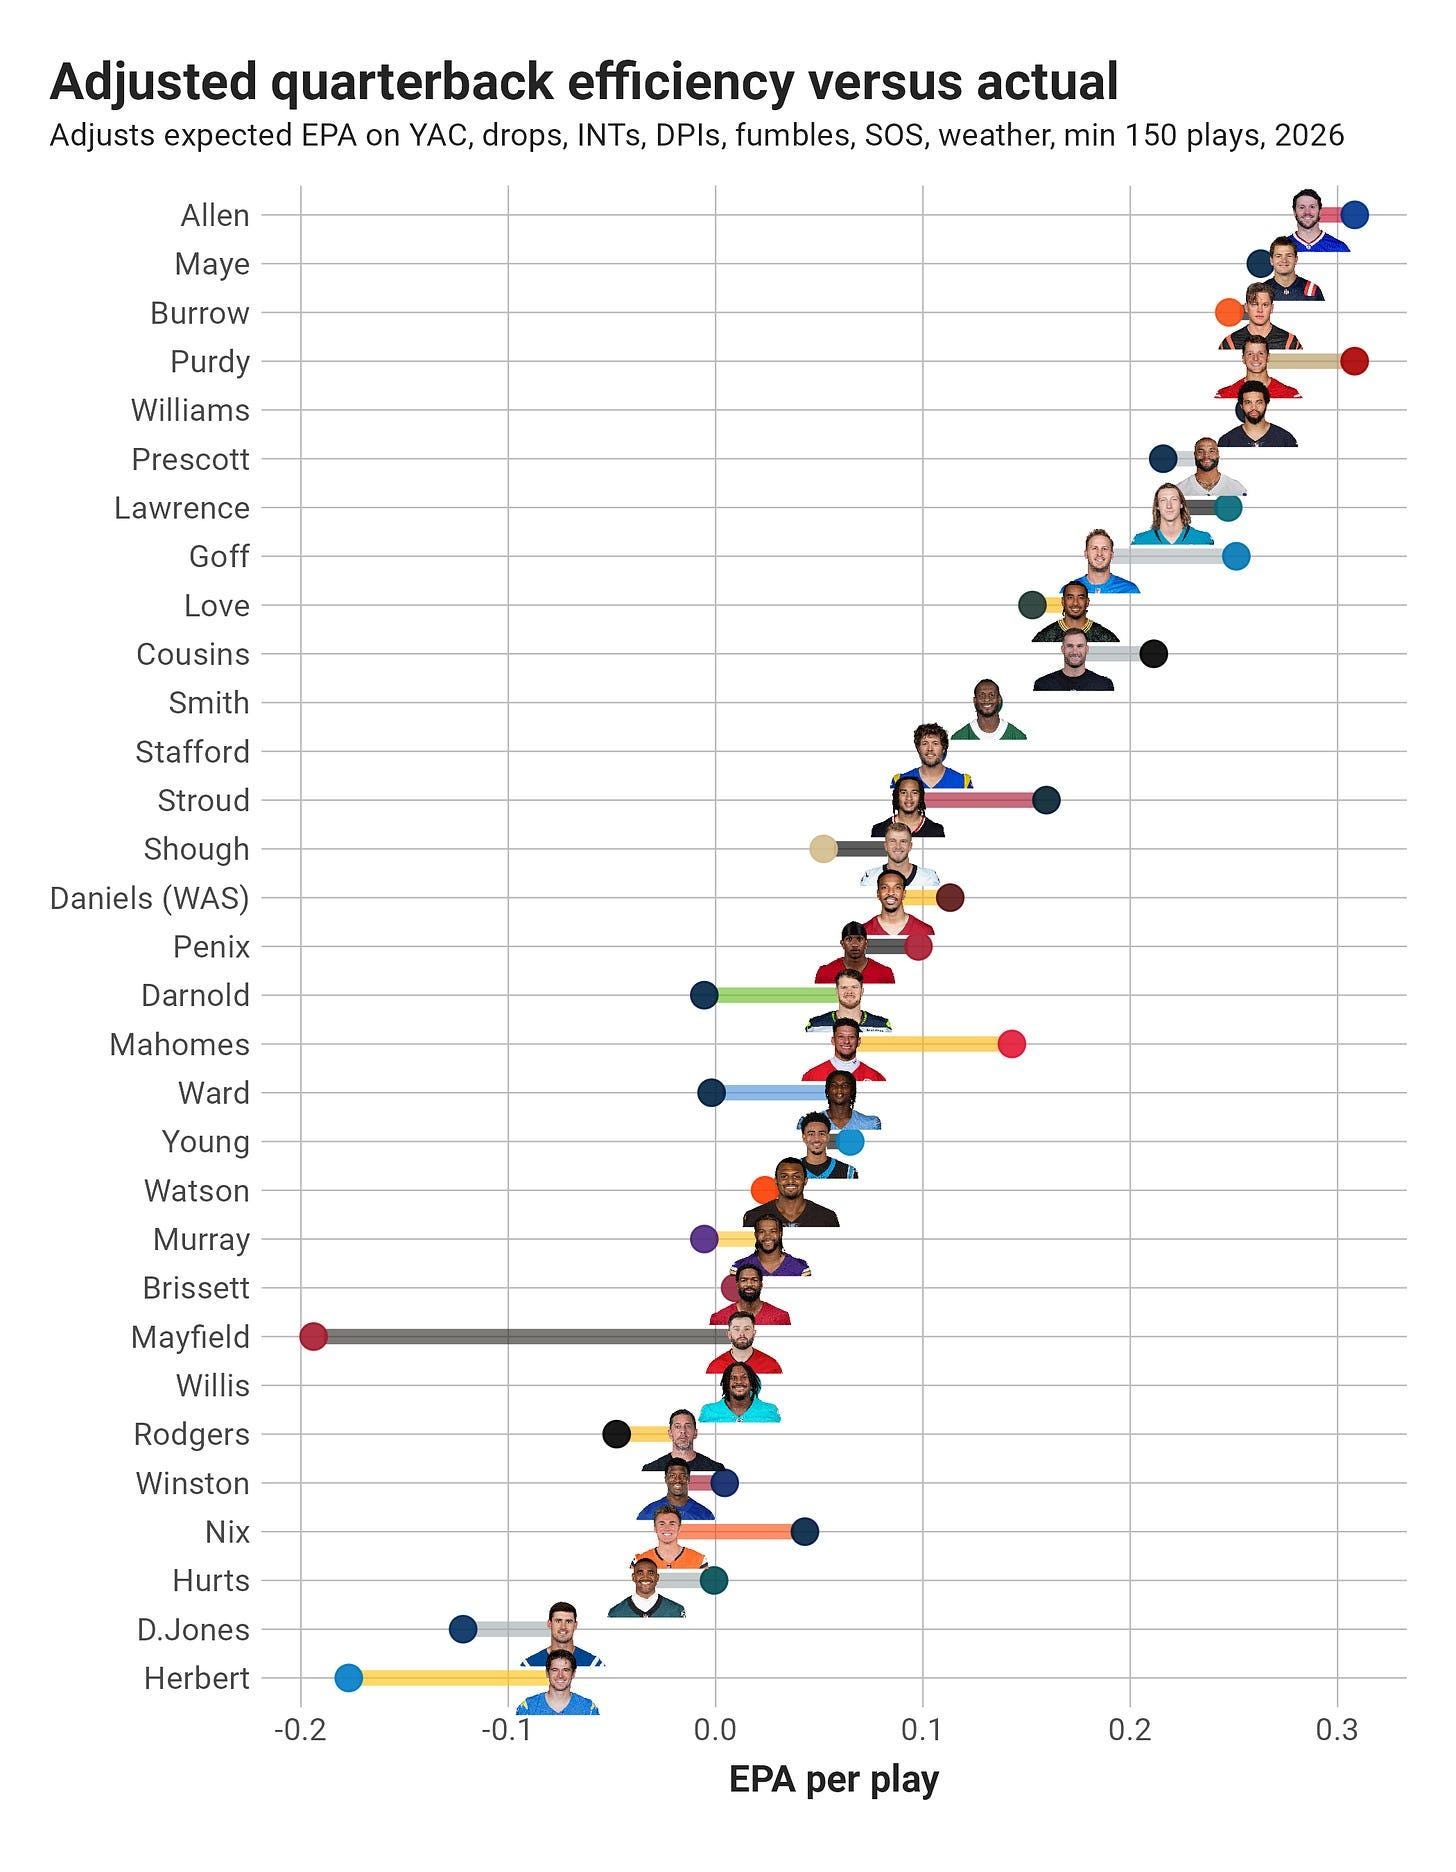
Josh Allen stays at the top of the AQE rankings, and is second to Dak Prescott in total adjusted EPA (see below), having played one less game and 68 fewer play involvements. Allen had a good Week 8 by adjusted EPA (+9.0), which exceeded his raw EPA (+5.6), mostly due to a receiver drop that turned into an interception (+2.5 EPA adjustment). Allen is at the top of a bunched top tier for AQE, followed by Drake Maye, Brock Purdy, Joe Burrow and Caleb Williams. Purdy was on bye in Week 8.
On massive volume, Burrow had a huge week, generating +17.1 adjusted EPA, the third highest total of any quarterback. Burrow also leads the NFL in PFF offensive grading by a large margin, sitting in his own tier among quarterbacks that hit my 150-play threshold.
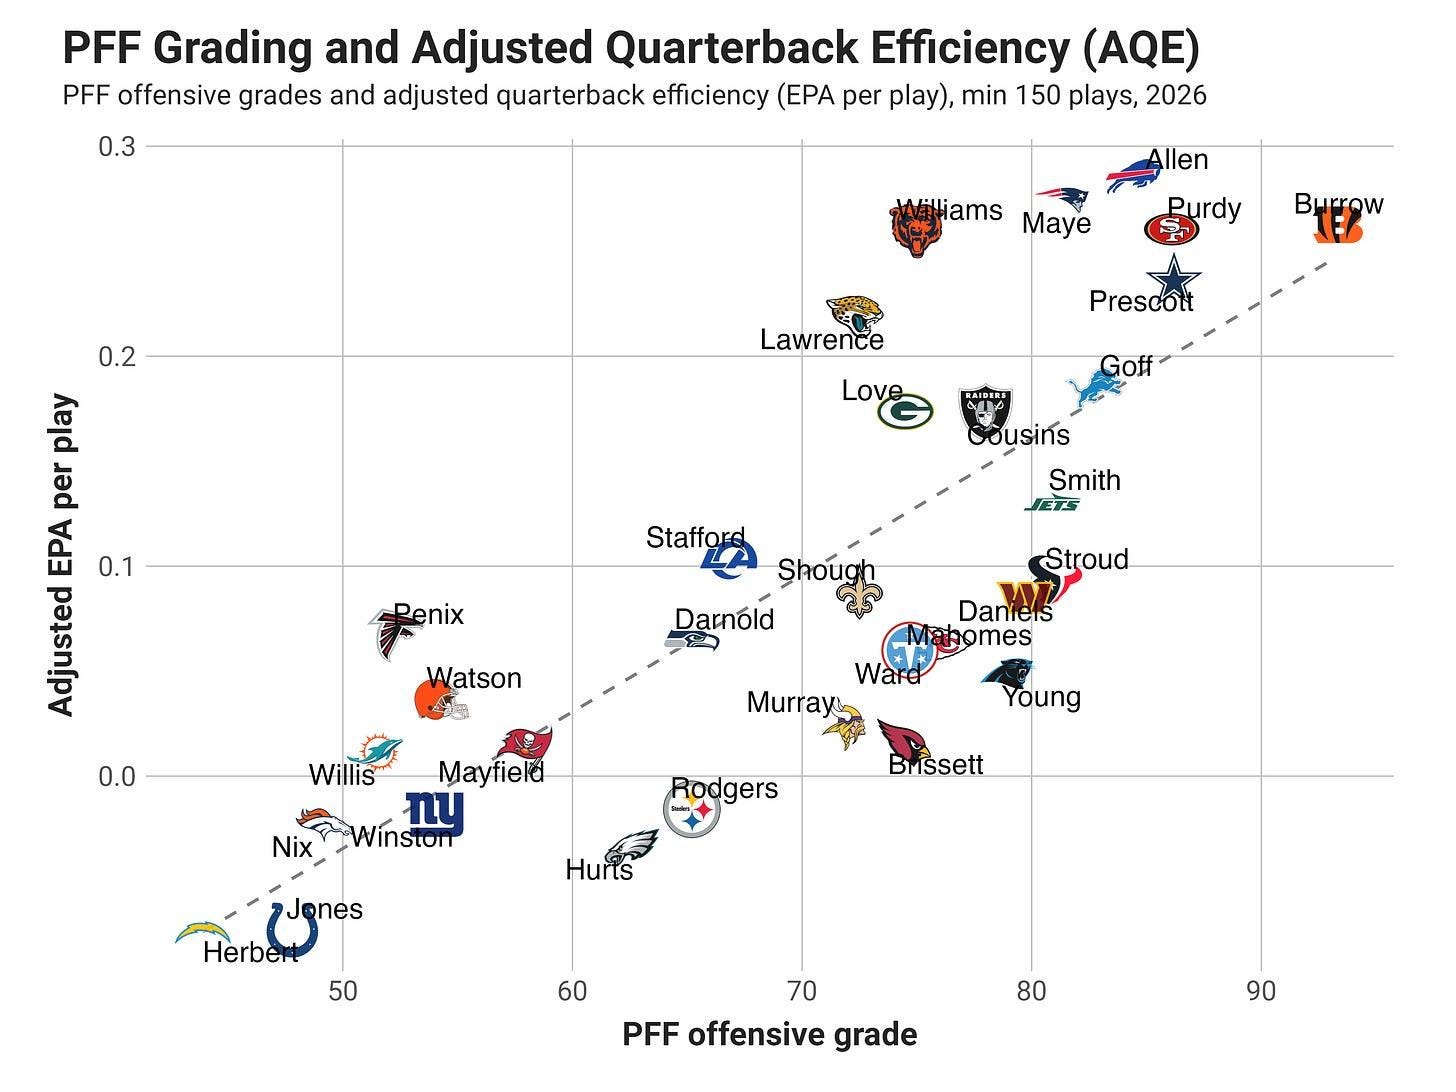
Williams had the biggest relative jump in MVP chance on the week, going from around 6% to 12% after beating the Seattle Seahawks on the road. I’m kicking myself for not buying Williams going into the game, as I noticed that his chance seemed low beforehand. But now that he’s at 12%, the reasons to fade his chance are more relevant.
First, Williams has played a lot less than other top contenders
