


The adjusted scores quantify team play quality, with emphasis on stable metrics (success rate) and downplaying higher variance events (turnovers, special team, penalties, fumble luck, etc). Adjusted expected points added (EPA), in conjunction with opportunity-based metrics like total plays and drives, projects adjusted points. Adjusted scores have been tested against actual scores and offer slightly better predictive ability, though their primary benefit is explanatory.
All 2022-2026 and historical Adjusted Scores and other site metrics are available in a downloadable format to paid subscribers via Google Sheet.
Find previous advanced reviews here
Unexpected Points is a reader-supported publication. To receive new posts and support my work, consider becoming a free or paid subscriber.
** Adjusted Scores table:
“Pass” - Pass rate over expectation (based on context of each play and historical averages
“Success” - Success rate on offense, a key metric in adjusted score vs actual
“H & A” - Home or away team
Ravens vs Jaguars (-8.5, 78%)

It was an even easier win than expected for the Jacksonville Jaguars against the injury-depleted Baltimore Ravens, as the Ravens went into a shell and didn’t attempt to throw the ball and come back with third-string quarterback Joe Fagnano.
The Ravens ran the ball on 60% of plays, an absurd 30% over expectation when accounting for contextual factors like score differential. The Ravens were roughly equally unsuccessful both dropping back to pass and running the ball (~30% rate), while their defense held the Jaguars offense to somewhat better than average metrics: 45% success rate and 55th percentile EPA efficiency.
The game reached official garbage time (99% WP for one team) with three minutes left in the third quarter, meaning the entire fourth quarter’s action doesn’t play into the team success rates in the table above.
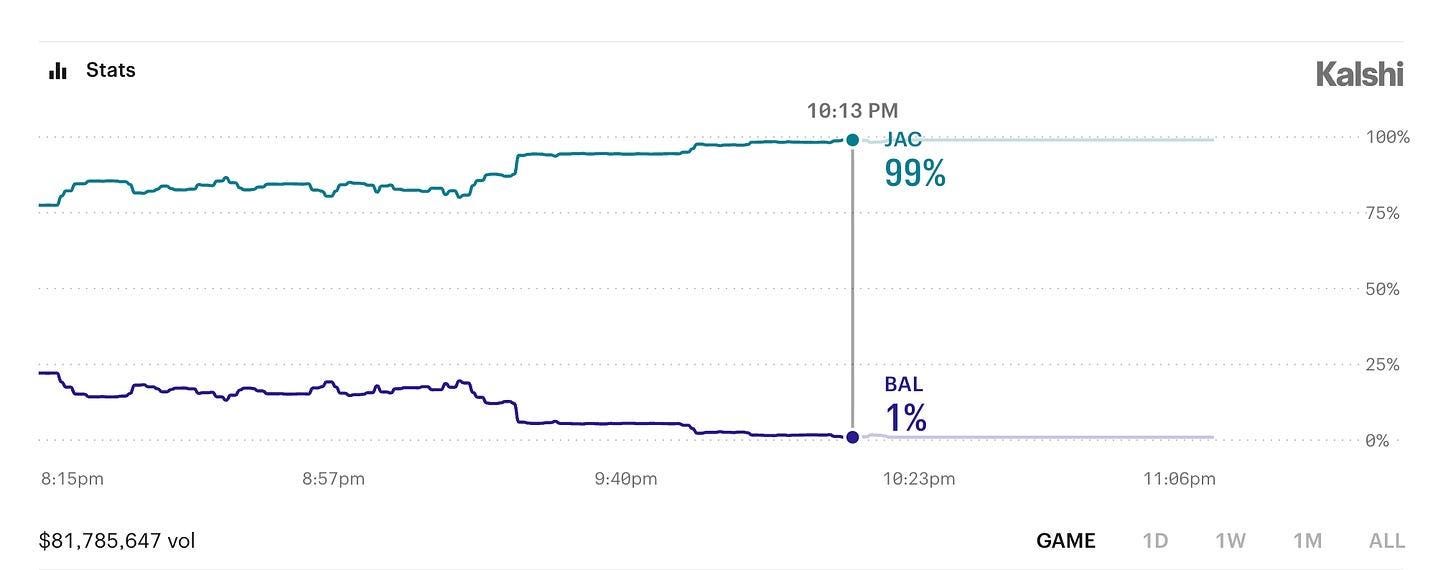
The Jaguars enjoyed advantages in turnovers (one to three, +9.1 EPA), late-down success (+7), penalties (+4.3) and special teams (+5.0). Cam Little made all four field goal attempts and three extra point tries (+3.1 EPA).
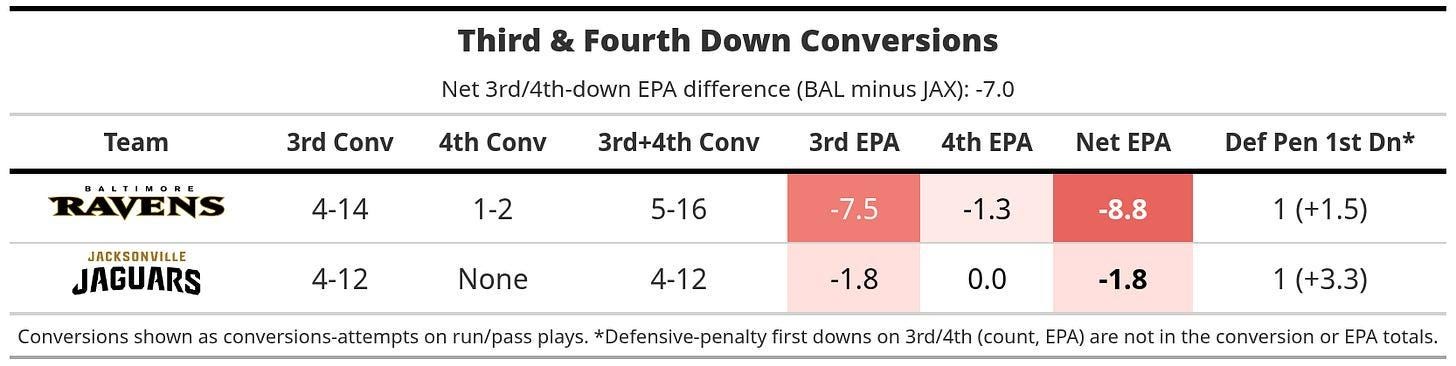
Neither team performed particularly well on late downs, but the Ravens were awful, as they were in most offensive metrics. The teams went a combined 8-for-26 on third down conversion attempts, dragging down overall EPA results.

The Ravens only dropped back to pass 21 times, and those plays led to just 64 yards, while their runs were fairly strong at 4.9 yards per play, but hurt severely by EPA due to a 4th-and-1 sneak failure by Mark Andrews (-3.2 EPA).