


The adjusted scores quantify team play quality, with emphasis on stable metrics (success rate) and downplaying higher variance events (turnovers, special team, penalties, fumble luck, etc). Adjusted expected points added (EPA), in conjunction with opportunity-based metrics like total plays and drives, projects adjusted points. Adjusted scores have been tested against actual scores and offer slightly better predictive ability, though their primary benefit is explanatory.
All 2022-2026 and historical Adjusted Scores and other site metrics are available in a downloadable format to paid subscribers via Google Sheet.
Find previous advanced reviews here
Unexpected Points is a reader-supported publication. To receive new posts and support my work, consider becoming a free or paid subscriber.
** Adjusted Scores table:
“Pass” - Pass rate over expectation (based on context of each play and historical averages
“Success” - Success rate on offense, a key metric in adjusted score vs actual
“H & A” - Home or away team
Packers (-3.5, 64%) vs Panthers

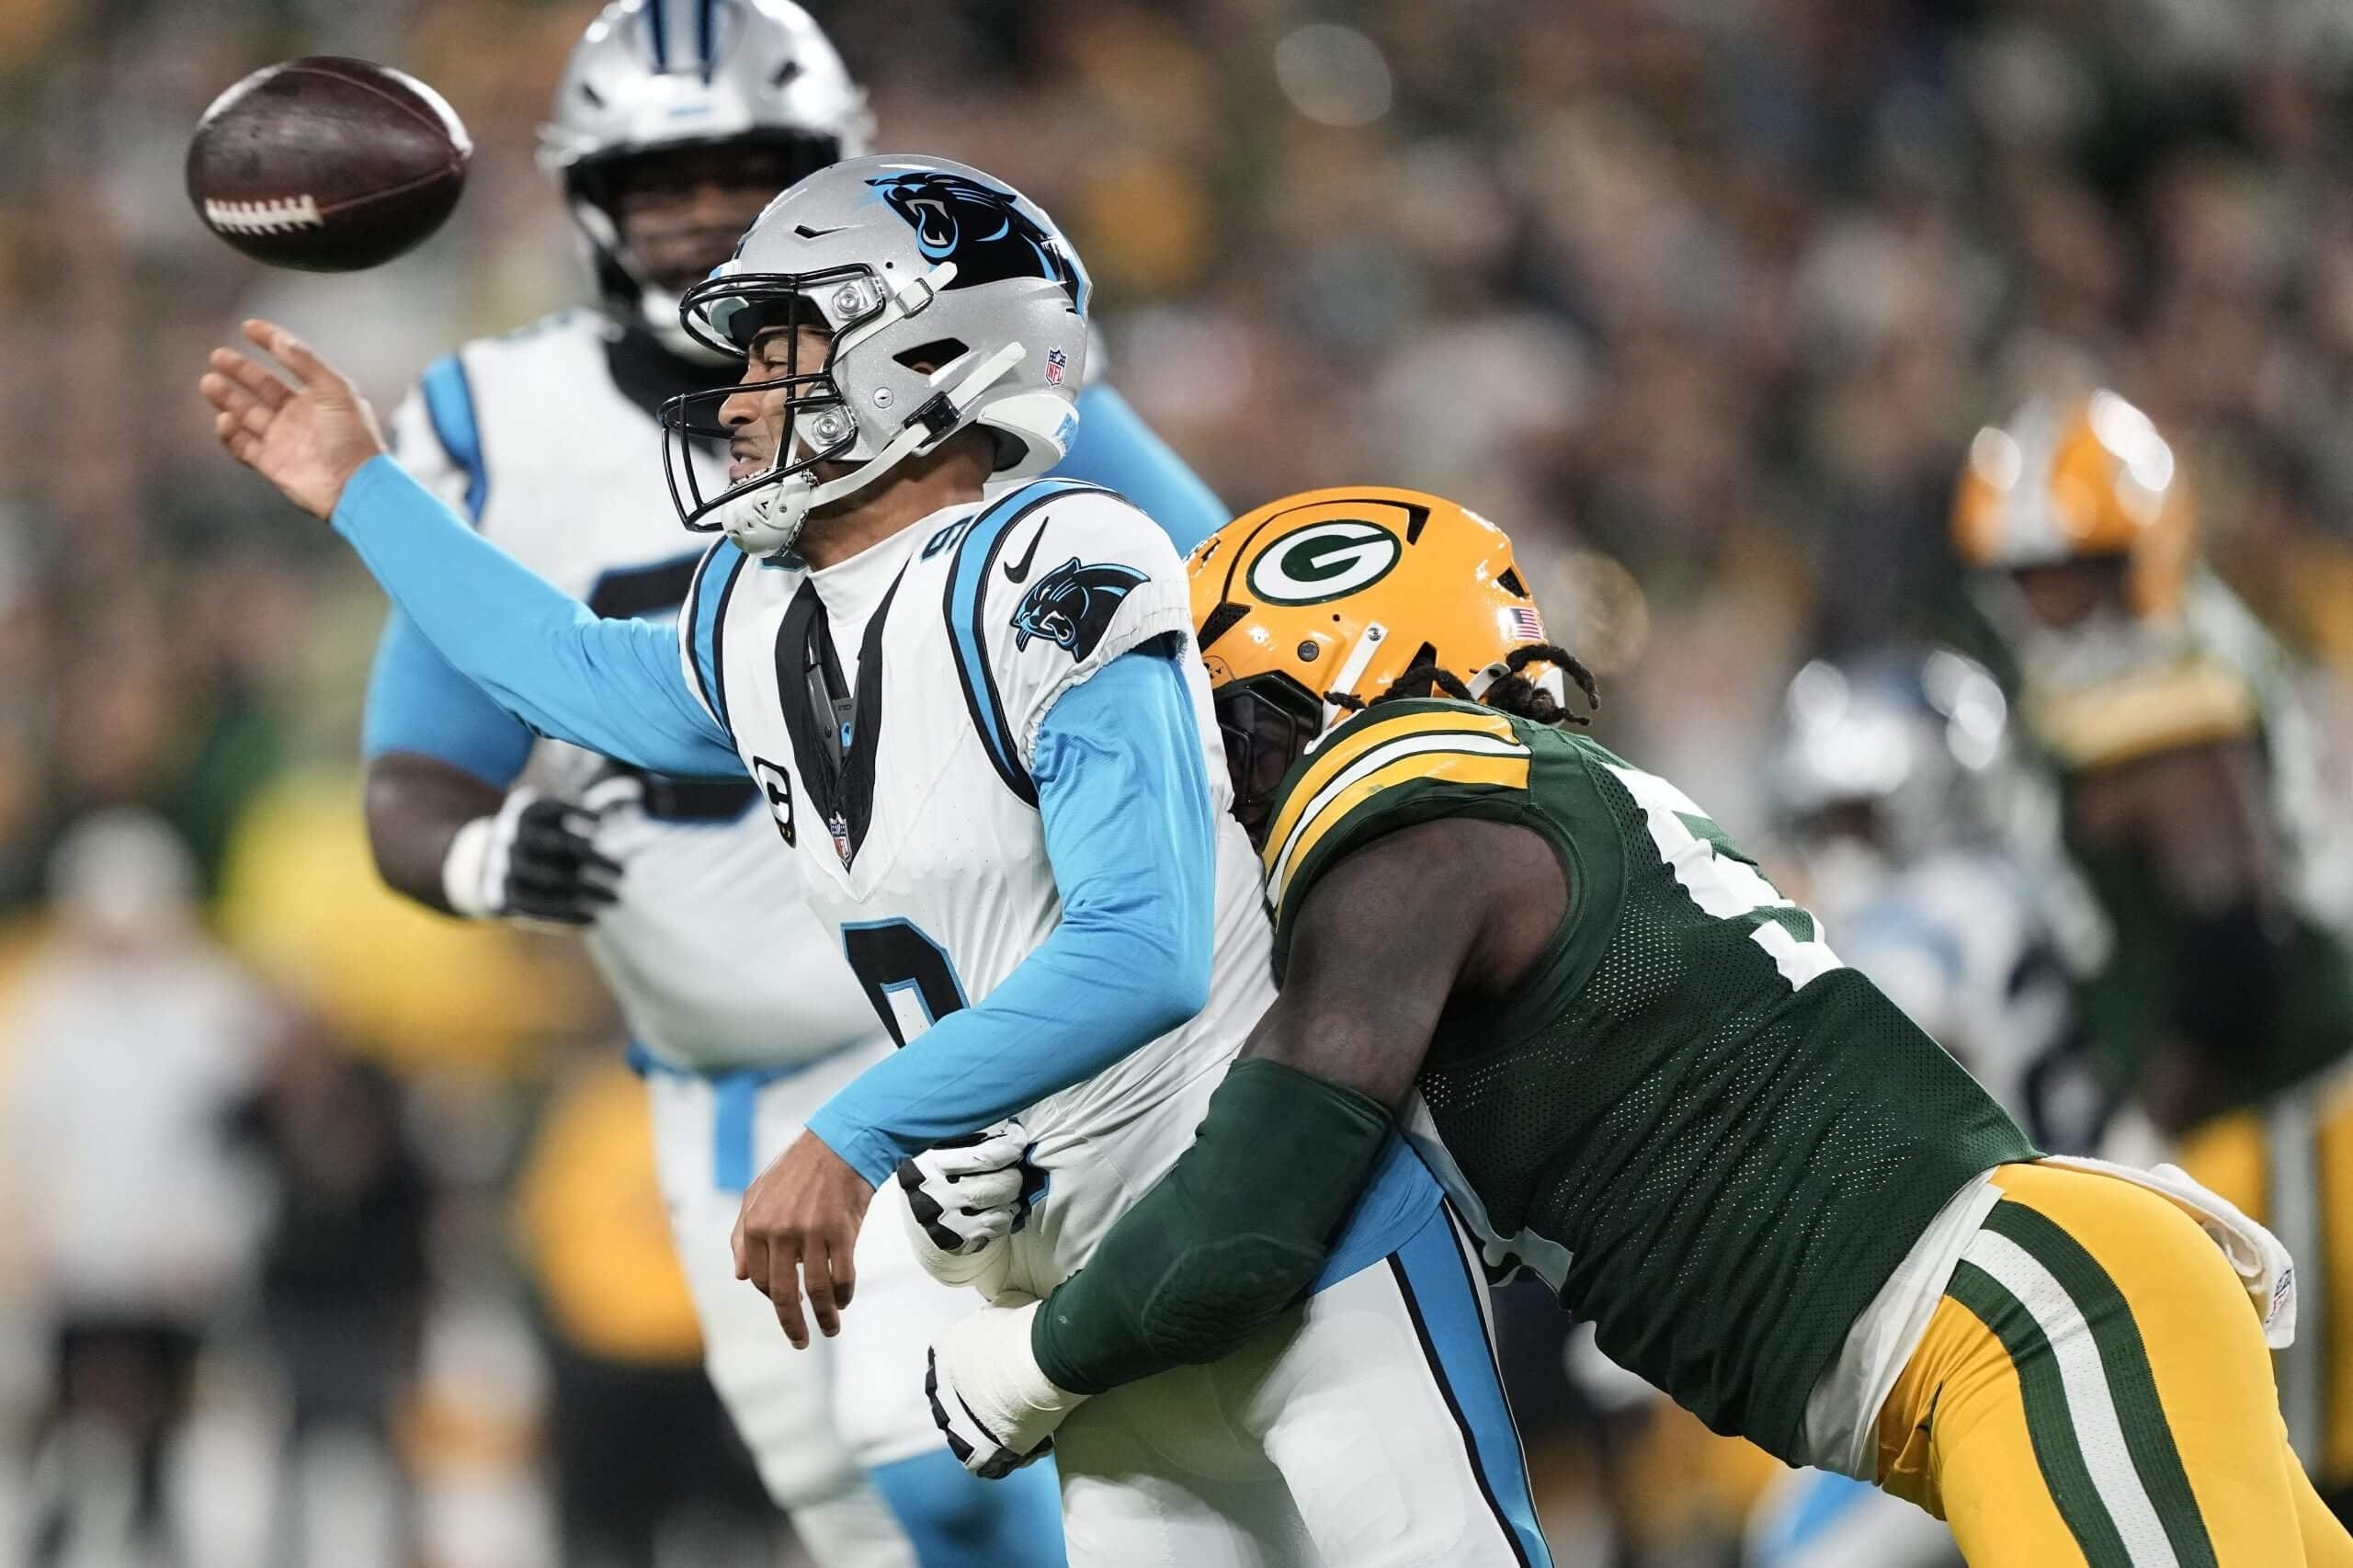
The Green Bay Packers got a solid victory at home, but it could have been much easier if not for their own mistakes. The Packers lost two of their three fumbles (-8.9 EPA), including on the opening kickoff (-5.4), and suffered a -10.4 EPA disadvantage on special teams in total. The Packers were able to win despite those issues, with their defense holding the Carolina Panthers to a 33% success rate and 3.7 yards per play.
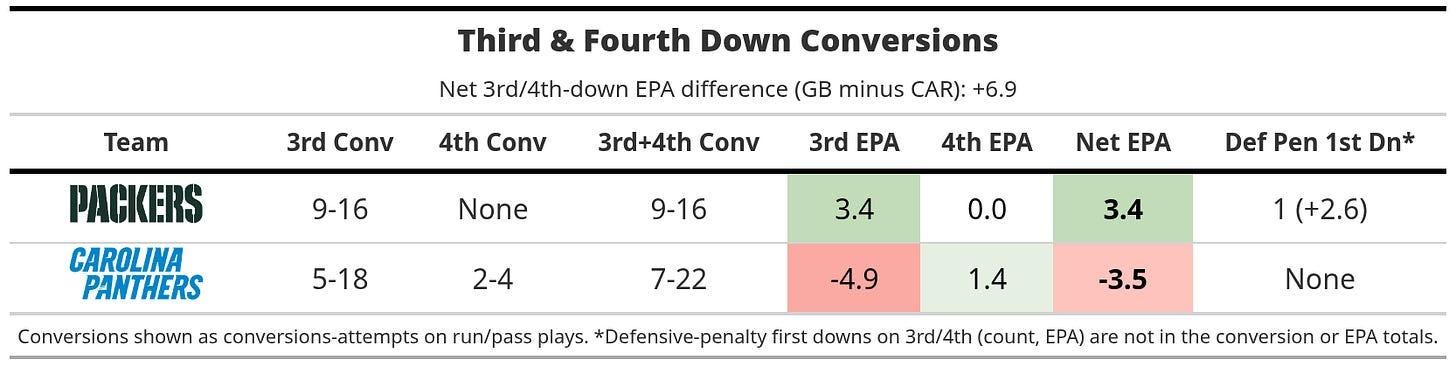
Offensively, the Packers juiced their EPA efficiency to the 60th percentile from a more modest 5.3 yards per play (45th percentile) on the back of several explosive plays. And that includes the considerable headwind to EPA from multiple offensive turnovers (-7.0 EPA).

The Packers’ proficiency on offense was all through the air, averaging 7.0 yards per attempt to only 2.5 on the ground. Whereas the Panthers offense was poor in both phases, with six sacks for 33 yards lost and a tipped interception (-4.4 EPA) weighing heavily on their dropback efficiency.