


The adjusted scores quantify team play quality, with emphasis on stable metrics (success rate) and downplaying higher variance events (turnovers, special team, penalties, fumble luck, etc). Adjusted expected points added (EPA), in conjunction with opportunity-based metrics like total plays and drives, projects adjusted points. Adjusted scores have been tested against actual scores and offer slightly better predictive ability, though their primary benefit is explanatory.
All 2026-2022 and historical Adjusted Scores and other site metrics are available in a downloadable format to paid subscribers via Google Sheet.
Find previous advanced reviews here
Unexpected Points is a reader-supported publication. To receive new posts and support my work, consider becoming a free or paid subscriber.
** Adjusted Scores table:
“Pass” - Pass rate over expectation (based on context of each play and historical averages
“Success” - Success rate on offense, a key metric in adjusted score vs actual
“H & A” - Home or away team
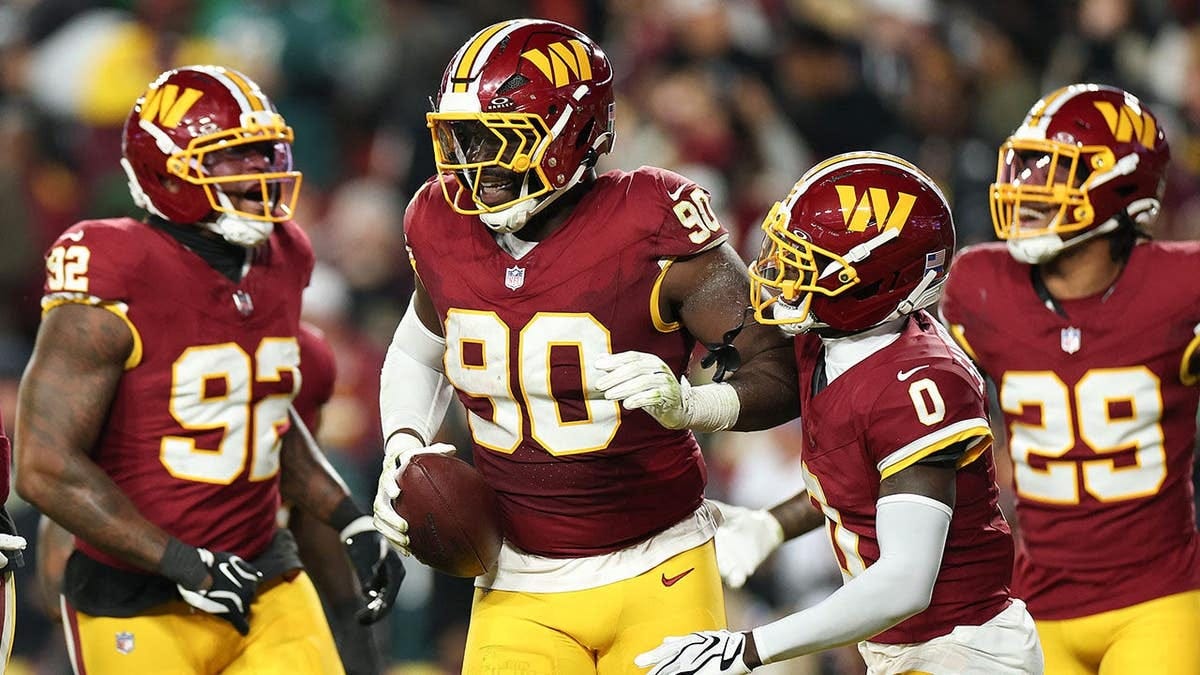
Commanders (-6, 69%) vs Eagles

The Washington Commanders had a sloppy start, missing a 55-yard field goal attempt, going 3-and-out and losing a post-catch fumble on their first three drives, setting up a 10-point hole they dug themselves all the way out of, and then some. The adjusted scores weren’t particularly impressed by the 17-point victory, as both teams posted pedestrian offensive success rates.
The Philadelphia Eagles didn’t score in the final three quarters, with Jake Elliott missing a 41-yard field goal in the fourth to cut the lead to three, needing to retake the kick after a penalty wiped a make off the scoreboard.
