Week 7 Late Window: Advanced Reviews
All the advanced stats, visualizations & commentary for Broncos-Giants, Chargers-Colts, Cardinals-Packers and Cowboys-Commanders

The adjusted scores quantify team play quality, with emphasis on stable metrics (success rate) and downplaying higher variance events (turnovers, special team, penalties, fumble luck, etc). Adjusted expected points added (EPA), in conjunction with opportunity-based metrics like total plays and drives, projects adjusted points. Adjusted scores have been tested against actual scores and offer slightly better predictive ability, though their primary benefit is explanatory.
All 2025-2022 and historical Adjusted Scores and other site metrics are available in a downloadable format to paid subscribers via Google Sheet.
Find previous advanced reviews here
** Adjusted Scores table:
“Pass” - Pass rate over expectation (based on context of each play and historical averages
“Success” - Success rate on offense, a key metric in adjusted score vs actual
“H & A” - Home or away team
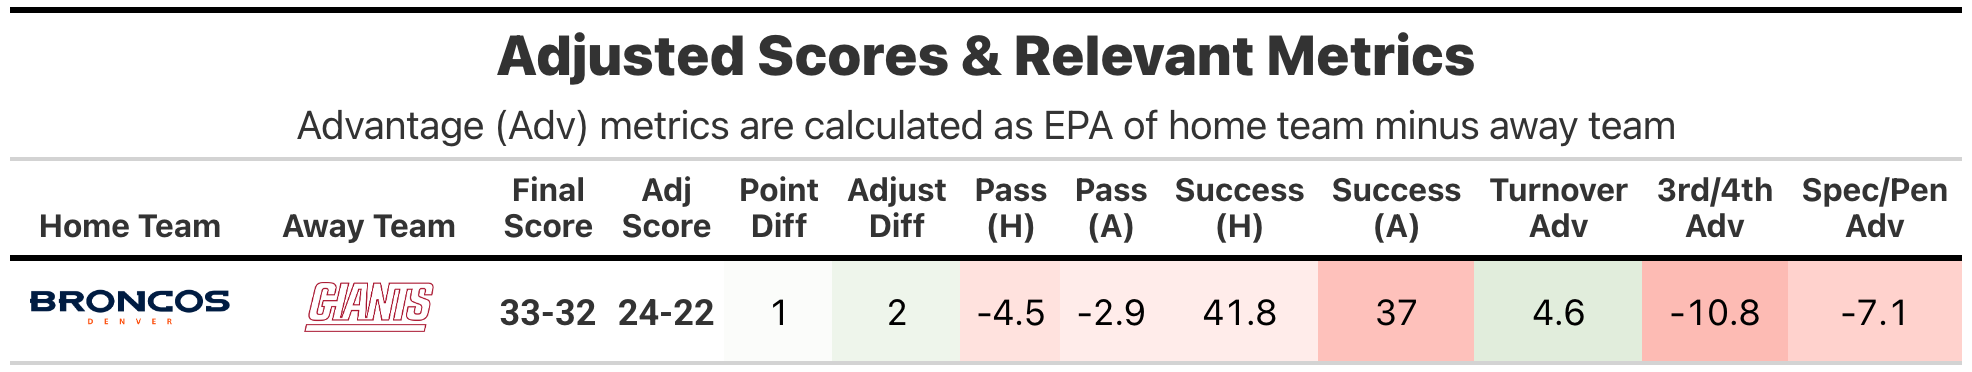
DEN (-7.5) vs NYG
With 33 points in the fourth quarter, the Denver Broncos made the improbable comeback against the New York Giants. It’s one thing to make up a 19-point deficit going into the final quarter, it’s another to do that when you also let your opponent score 13 more points in said quarter.
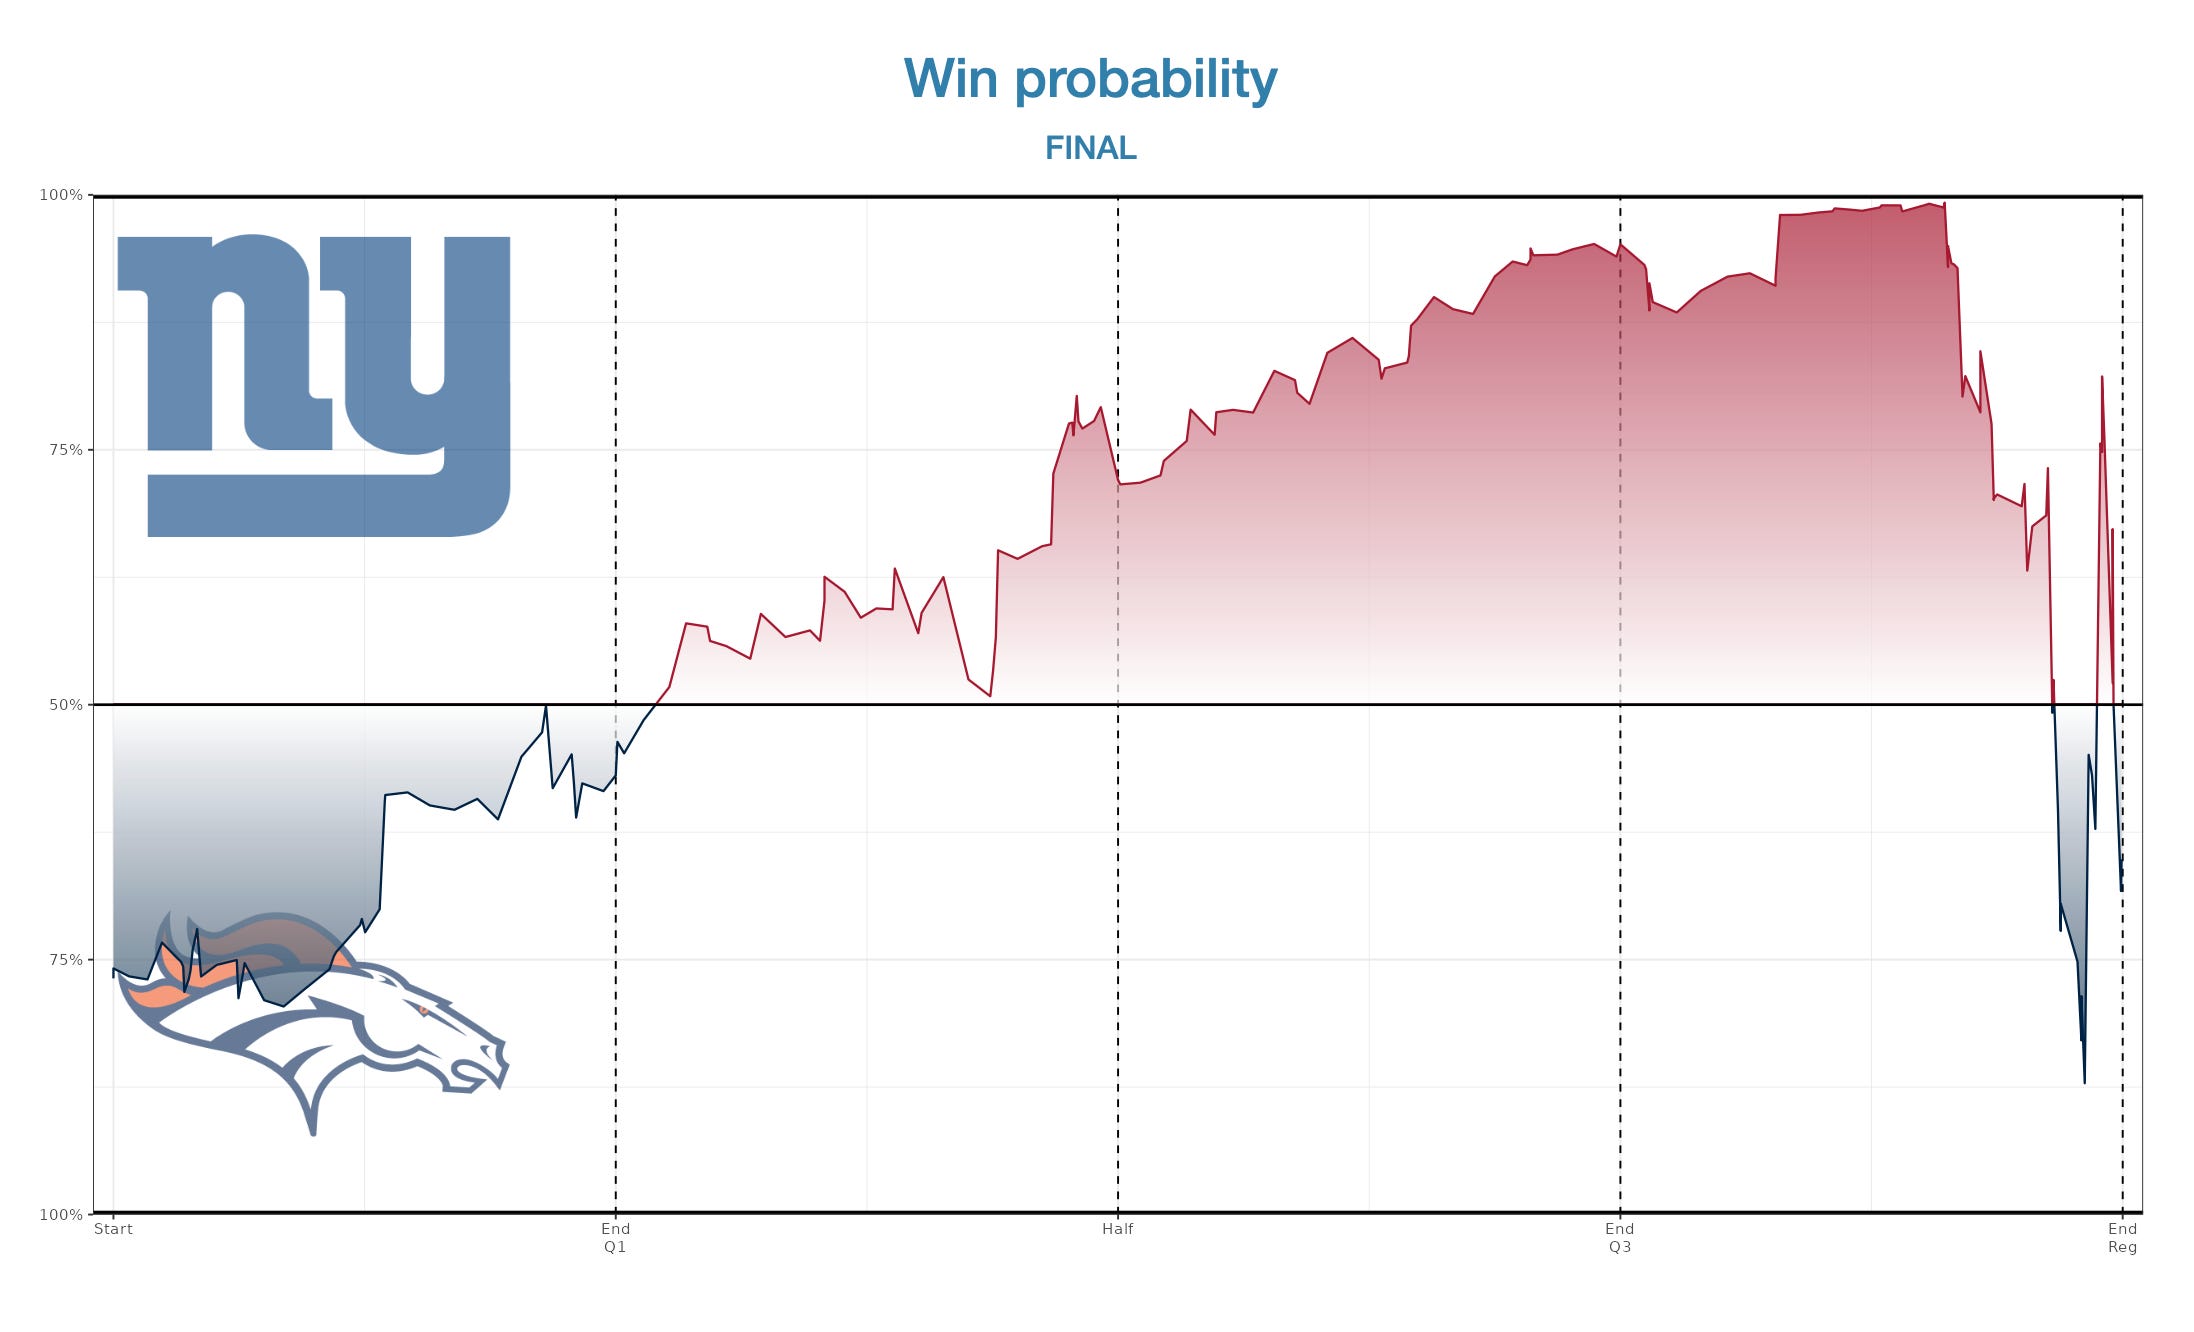
According to the rbsdm.com win probability model, the Giants win probability was roughly 95% to start the fourth quarter, and topped out at 98% when the Giants scored with 10 minutes left pushing the score to 26-8. The Broncos took more than five minutes to score their next touchdown, which only slightly moved up their win probability, as they needed quicker scores. Their next two touchdowns came in less than three-and-a-half minutes, stopping the Giants twice on possessions that only ate up 80 seconds combined.
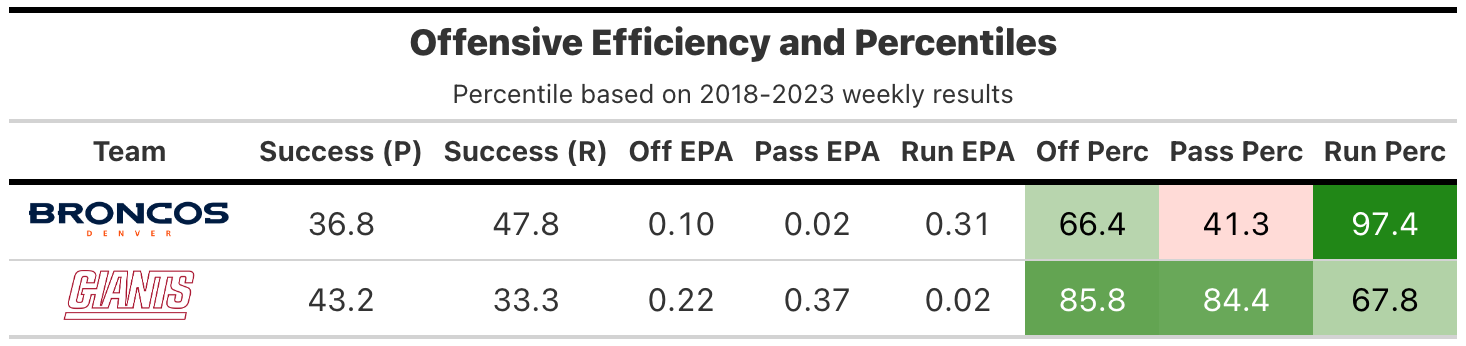
It was a shockingly productive game for both offenses considering their subpar success rates (42% DEN, 37% NYG), based on explosive plays, red zone efficiency (combined to score touchdowns on 6-of-7 trips into), penalty gains (total of nine first downs via penalty), and elevated possession opportunities (25 total).
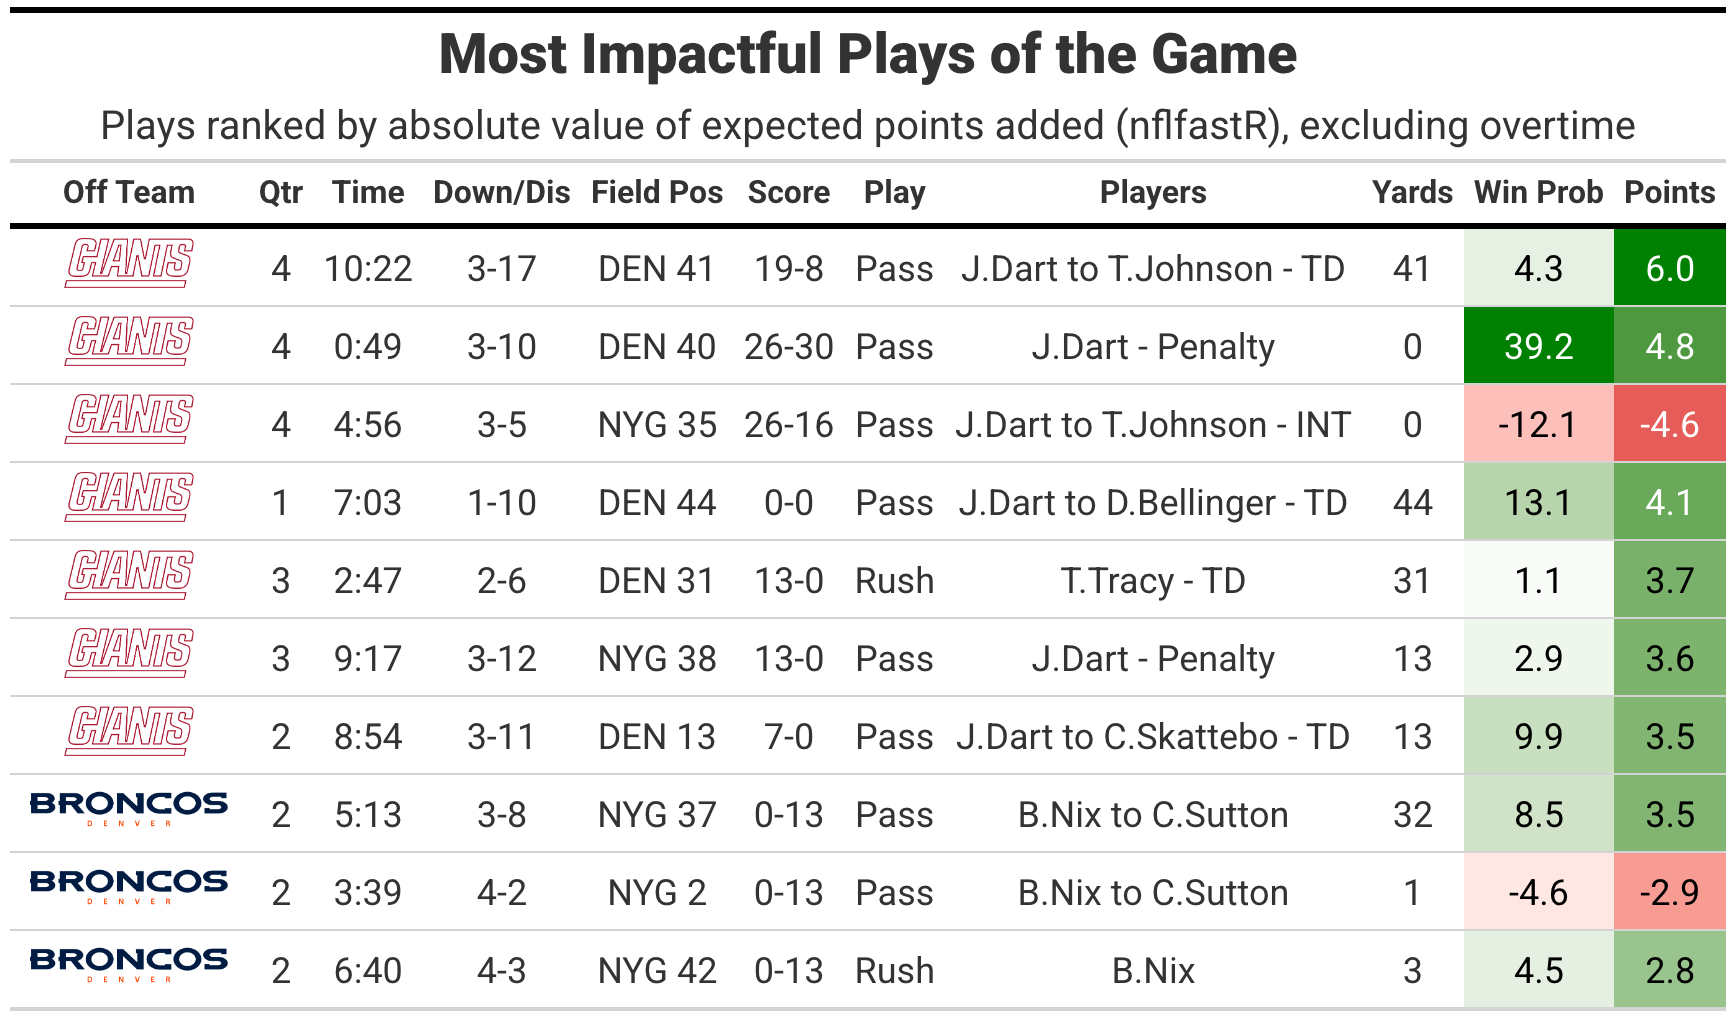
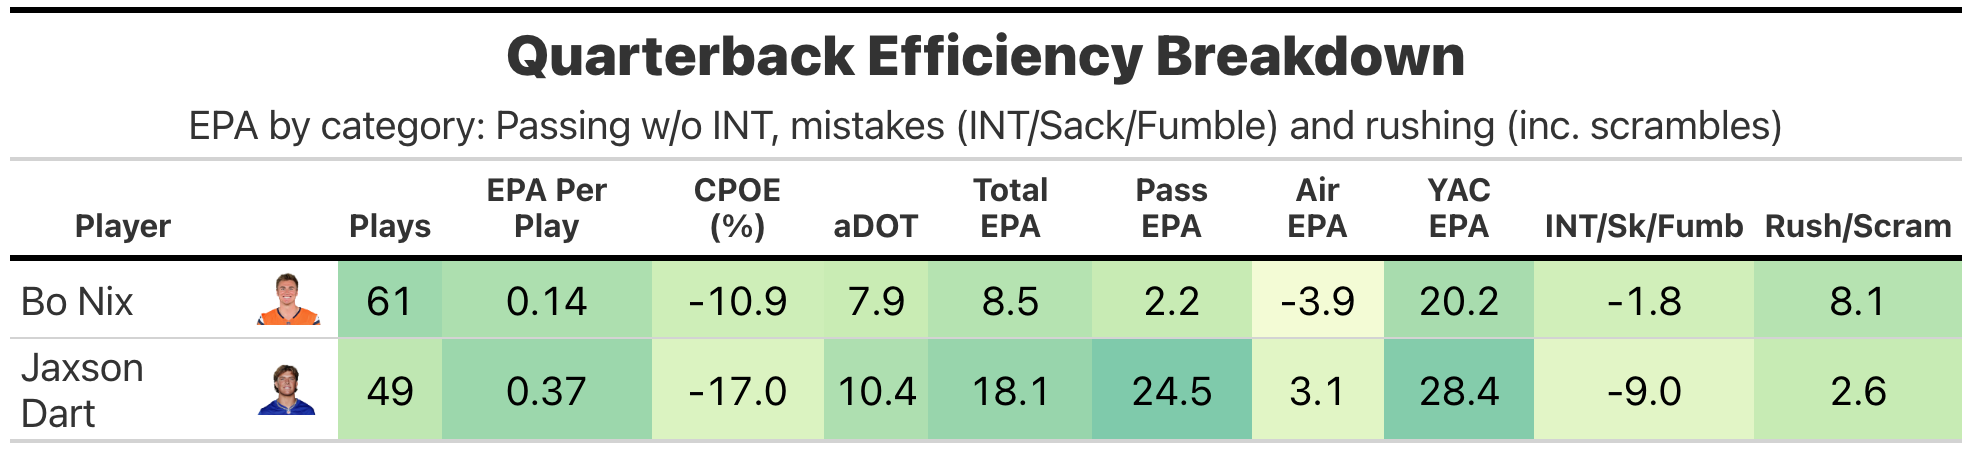
Both quarterbacks were efficient on higher volume, though Jaxson Dart was better by per-play and total EPA gained, despite a critical interception and four sacks that cost the Giants a combined 9.0 expected points.
Bo Nix played a cleaner game, but needed a massive +8.1 EPA in scrambles and designed run value to boost his value, with his passing EPA only totaling +2.2 EPA.
Both quarterbacks were inaccurate by the numbers, but absurd levels of receiver YAC value drove them to overall success. I suspect my adjusted efficiency numbers won’t be nearly as positive for both.