

Week 5 London & Early Window: Advanced Reviews
Bills and Ravens lose games they should have won, plus a lot more rope now for Desmond Ridder


The adjusted scores quantify team play quality, with emphasis on stable metrics (success rate) and downplaying higher variance events (turnovers, special team, penalties, fumble luck, etc). Adjusted expected points added (EPA), in conjunction with opportunity-based metrics like total plays and drives, projects adjusted points. Adjusted scores have been tested against actual scores and offer slightly better predictive ability, though their primary benefit is explanatory.
All 2023 & 2022 and historical Adjusted Scores and other site metrics are available in a downloadable format to paid subscribers via Google Sheet.
Find previous advanced reviews here
** Adjusted Scores table:
“Pass” - Pass rate over expectation (based on context of each play and historical averages
“Success” - Success rate on offense, a key metric in adjusted score vs actual
“H & A” - Home or away team
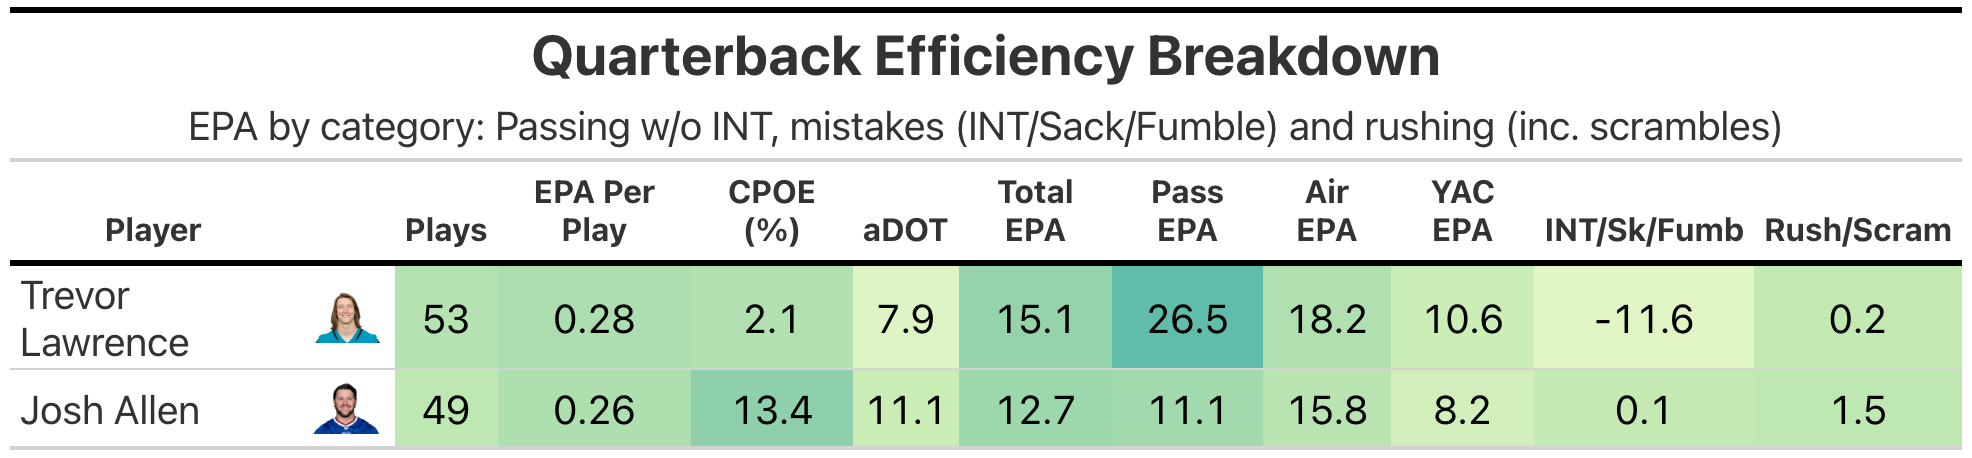
BUF vs JAX

Despite a healthy turnover advantage and materially stronger offensive success rate, the Bills trailed for most of the game. The difference came on third downs, with the Jags converting 10-of-18 (+2.2 over expected) and the Bills going 5-of-12 (-0.5). Because of their ability to extended drives, the Jags ran 82 plays versus 54 for the Bills. Looking at traditional stats, the Bills gained 7.2 yards per play to the Jags 5.8.
Only the Bills rushing game was a weakness for either offense, with the team’s running backs gaining 15 yards on 10 carries.

Trevor Lawrence slightly outperformed Josh Allen in efficiency, despite taking five sacks and losing two fumbles. Allen pushed the ball down the field (11.1-yard aDOT) and was more accurate (13.4% CPOE), but couldn’t make the plays when the Bills needed them, and didn’t get help from his rushing game, which consistently put him in poor down and distance context.
DET vs CAR
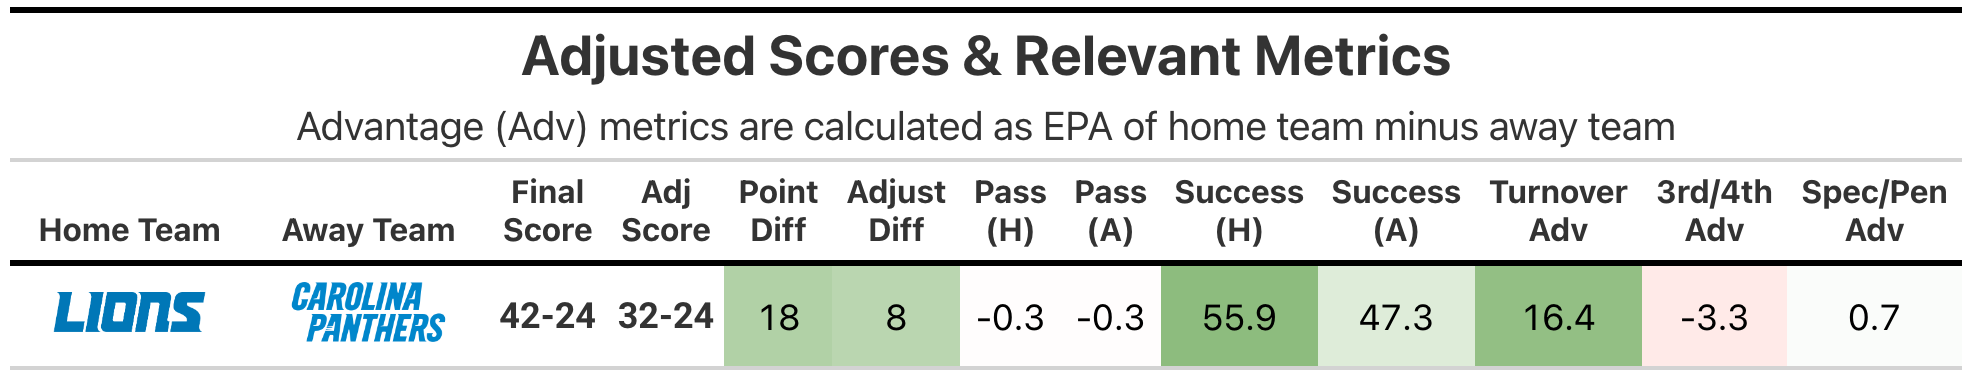
The adjusted score is a bit more narrow than the closer-than-it-really-was actual score. I think the numbers might be fooled a bit by the Panthers offense coming to life with the Lions somewhere between 99 and 100% win probability, scoring touchdowns on their final two drives. The Panthers defense was completely dominated by the Lions offense, hitting 97th percentile in offensive efficiency, both running and passing well. One reason the adjusted score is more narrow is the overwhelming turnover advantage for the Lions (3 forced to zero), generating 16.4 EPA.
