The adjusted scores quantify team play quality, with emphasis on stable metrics (success rate) and downplaying higher variance events (turnovers, special team, penalties, fumble luck, etc). Adjusted expected points added (EPA), in conjunction with opportunity-based metrics like total plays and drives, projects adjusted points. Adjusted scores have been tested against actual scores and offer slightly better predictive ability, though their primary benefit is explanatory.
All 2026-2022 and historical Adjusted Scores and other site metrics are available in a downloadable format to paid subscribers via Google Sheet.
Find previous advanced reviews here
Unexpected Points is a reader-supported publication. To receive new posts and support my work, consider becoming a free or paid subscriber.
** Adjusted Scores table:
“Pass” - Pass rate over expectation (based on context of each play and historical averages
“Success” - Success rate on offense, a key metric in adjusted score vs actual
“H & A” - Home or away team
Packers (-4.5) vs Falcons

The Green Bay Packers paired a poor-but-not-awful offensive performance with a horrendous effort on defense, allowing the previously moribund Atlanta Falcons offense to do, basically, whatever they wanted. The Falcons’ offense had a 62% success rate and nearly 95th percentile EPA efficiency, finding success on both dropbacks and designed runs.
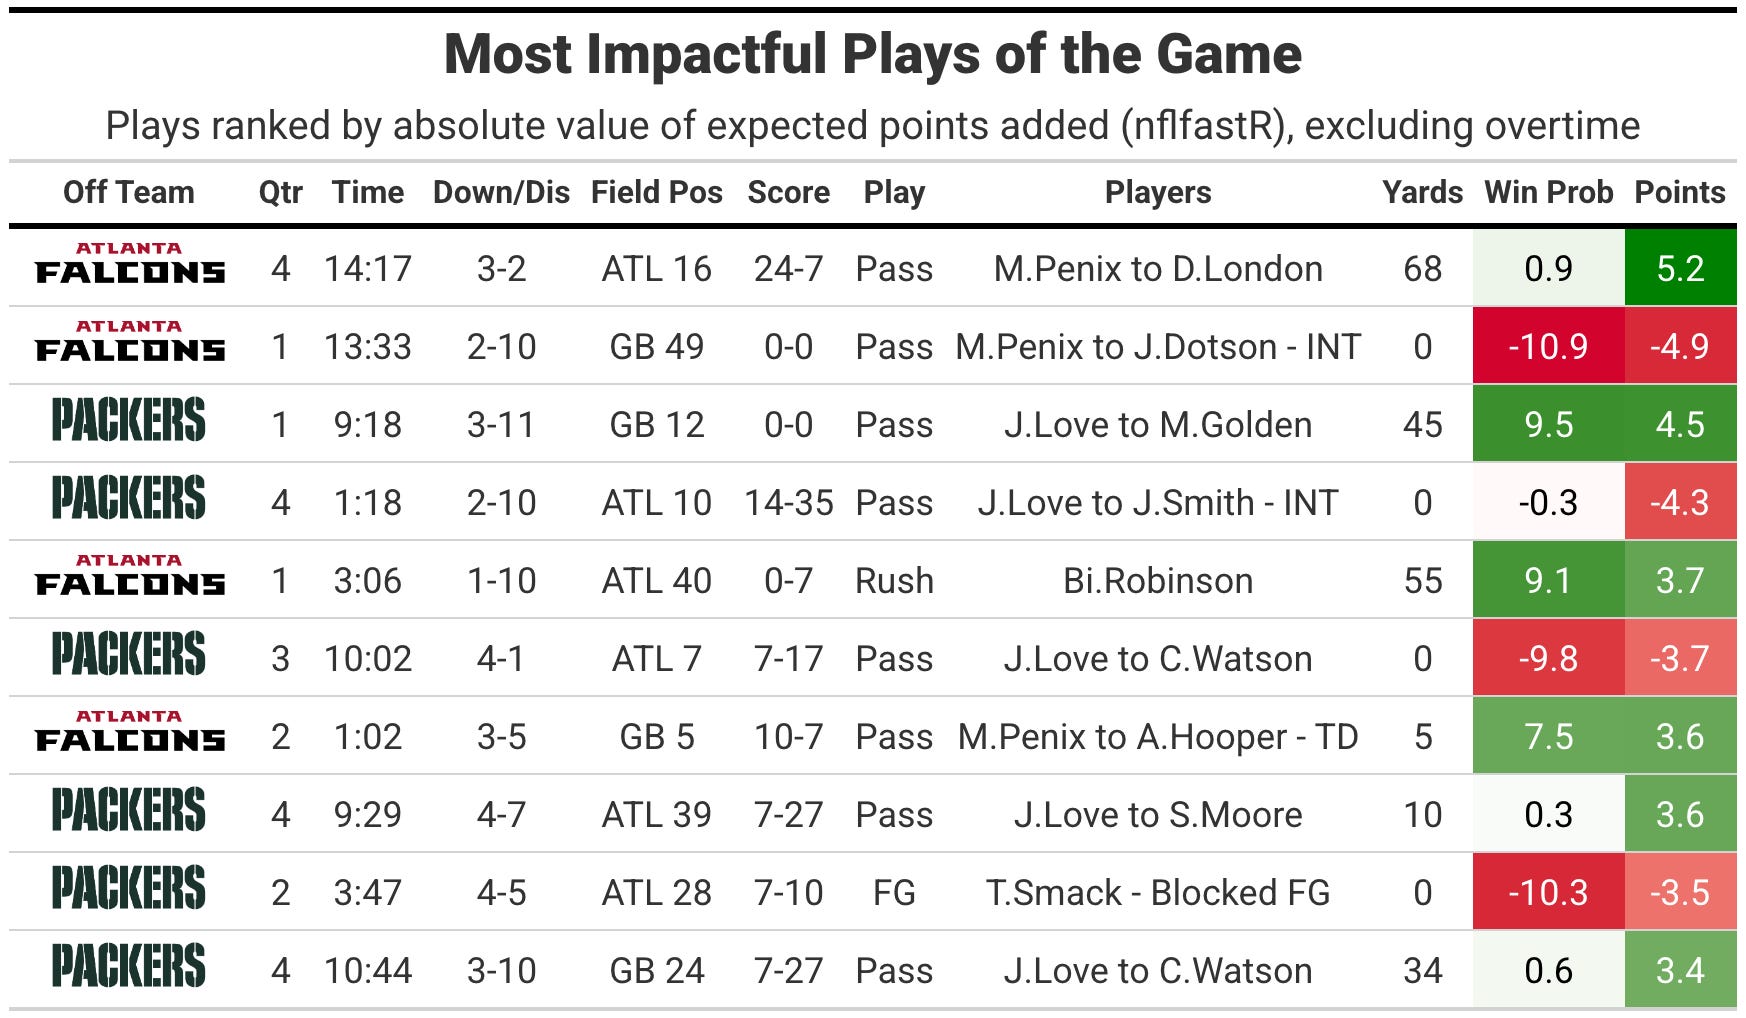
The game played out as a fairly even contest through the first half, with the Packers sitting at 60% win probability prior to their subsequently blocked game-tying field goal with a little under four minutes left in the second quarter. The next four possessions included two Falcons’ touchdowns, a Packers 3-and-out and a Packers 4th & 1 failure, making the score 24-7 Falcons and plunging the host’s win probability down to 8%.
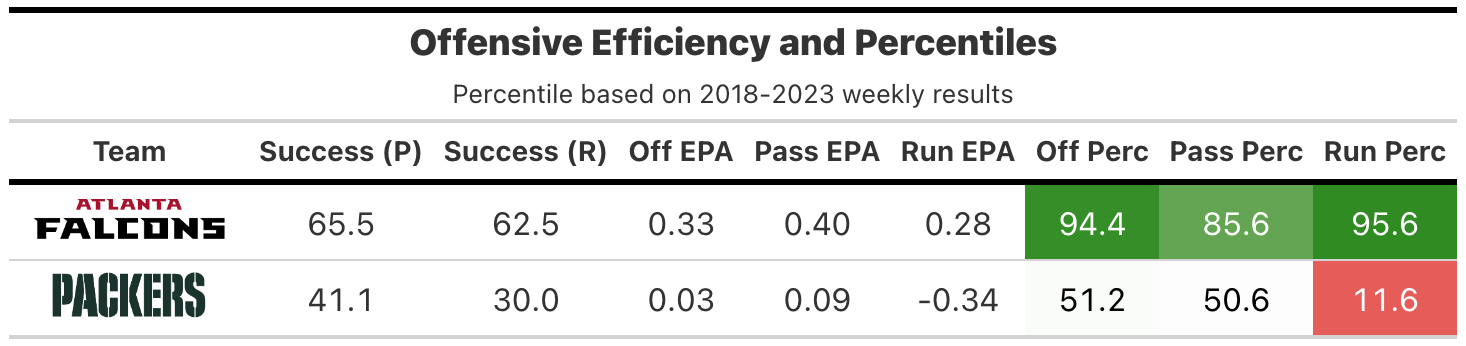
The Packers called only nine designed runs, gaining just 17 yards (-3.4 EPA). They were decently efficient on dropbacks (51st EPA percentile, +0.09 per play), but with a lower success rate of 41%. On a per-drive basis, the Packers offense looked functional, but they only had 10 possessions, five resulting in punts, two touchdowns, one interception, one blocked field goal and one 4th & 1 conversion failure. The Packers should have had at least a few more points scored, though it wouldn’t have been anywhere close to making the game competitive.
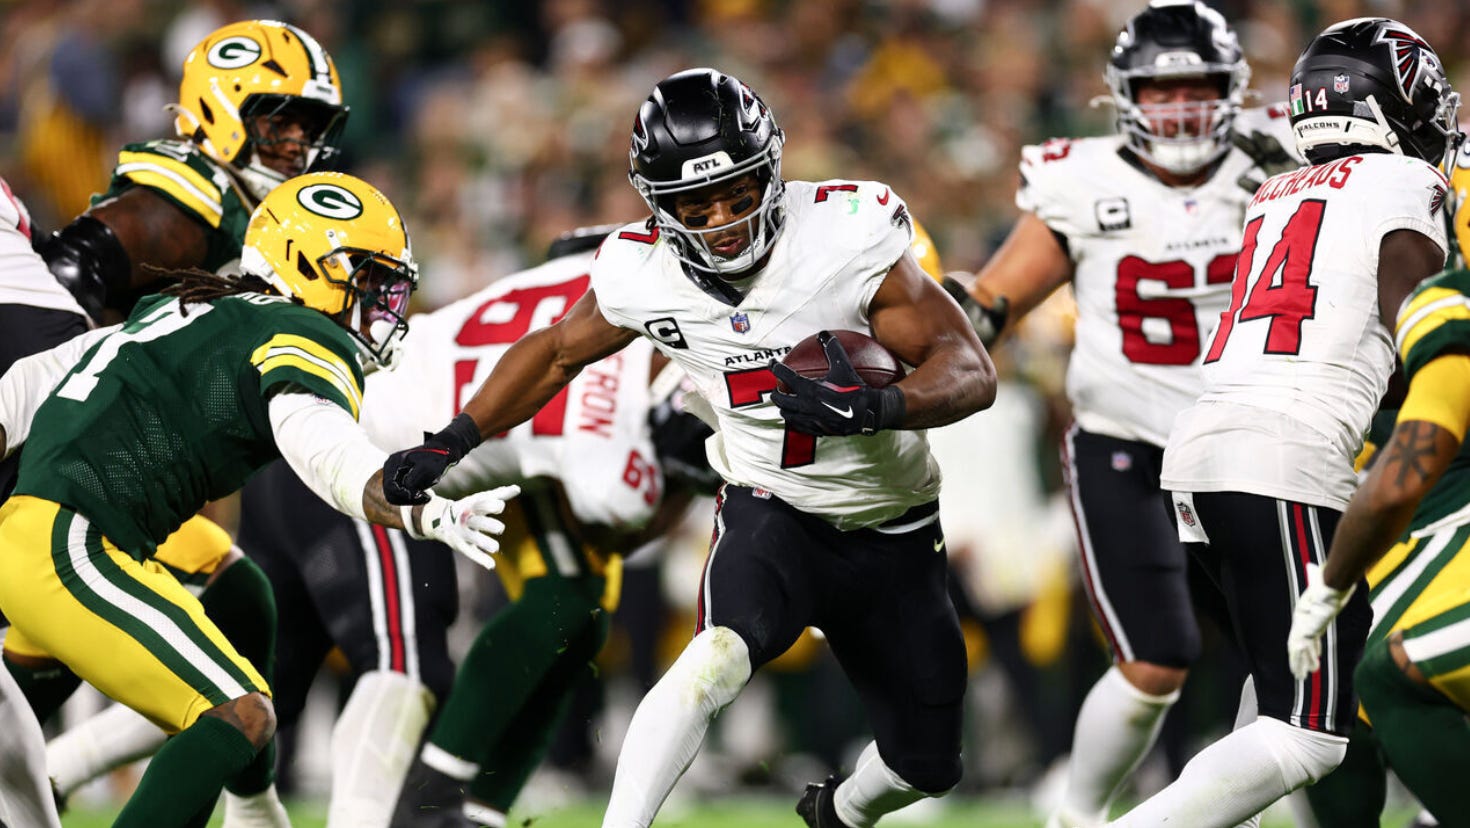
The basic efficiency stats for the Falcons’ offense were awesome, averaging 10.2 yards per dropback and 5.9 per designed run, converting 6-of-10 third downs (+11.9 EPA), including a 68 yard Drake London catch on 3rd & 2. London was incredibly valuable, with the Falcons’ offense generating +14.8 EPA on his 10 targets (nine catches for 194 yards), while Bijan Robinson posted elite rushing efficiency at +8.0 EPA on 29 carries (194 yards and two touchdowns).
It wasn’t a horrible game for Jordan Love by the numbers, but his 2026 campaign can’t be seen as anything but a massive disappointment, considering sleeper MVP talk and his third place finish in my adjusted quarterback efficiency metric last season. Love averaged +0.20 EPA per play in 2024, +0.29 in 2025 and it has fallen to exactly flat (0.00) in 2026, tied for 25th among quarterbacks this season. Love hasn’t gotten help from his running game or protection this year, with the Packers’ pass blocking grade at PFF ranking dead last this season.
The Packers’ implied probability to win the NFC North has fallen to roughly 10% after the loss, which was close to 30% leading into the season.
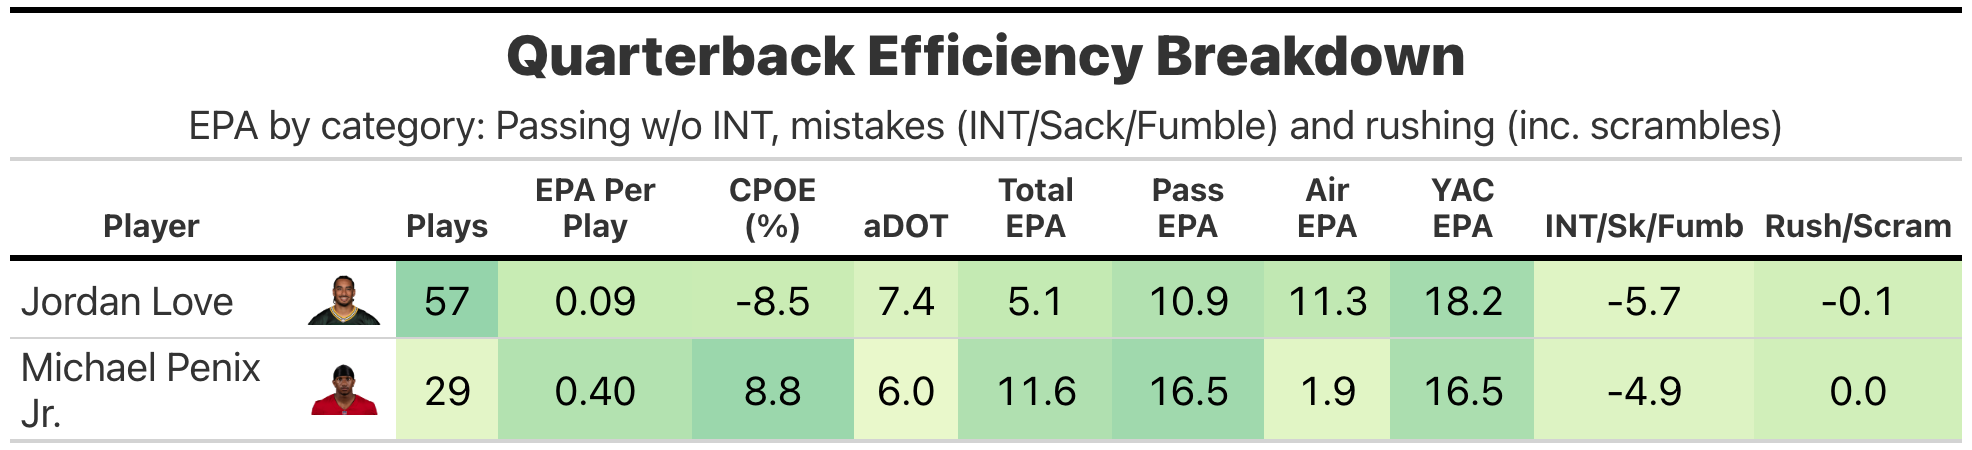
Michael Penix had a ton of support in the Falcons’ ground game, but he didn’t mess anything up, and, in fact, posted excellent numbers in efficiency and accuracy.