

Week 2 Sunday Night Vikings-Falcons: Advanced Review
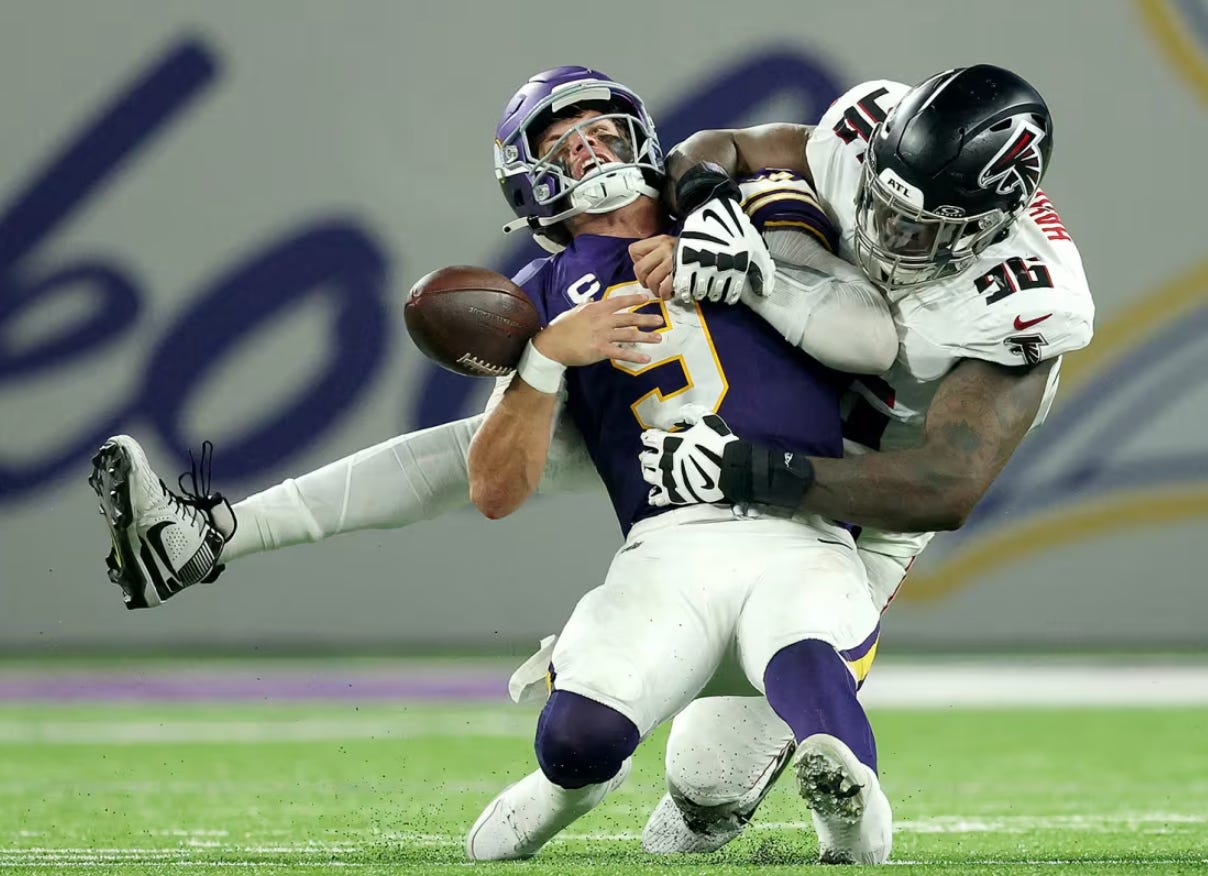
Dominant performance by the Atlanta Falcons defense, plus a strong running back, made easy work of the Minnesota Vikings

The adjusted scores quantify team play quality, with emphasis on stable metrics (success rate) and downplaying higher variance events (turnovers, special team, penalties, fumble luck, etc). Adjusted expected points added (EPA), in conjunction with opportunity-based metrics like total plays and drives, projects adjusted points. Adjusted scores have been tested against actual scores and offer slightly better predictive ability, though their primary benefit is explanatory.
All 2025-2022 and historical Adjusted Scores and other site metrics are available in a downloadable format to paid subscribers via Google Sheet.
Find previous advanced reviews here
** Adjusted Scores table:
“Pass” - Pass rate over expectation (based on context of each play and historical averages
“Success” - Success rate on offense, a key metric in adjusted score vs actual
“H & A” - Home or away team
MIN (-3.5) vs ATL
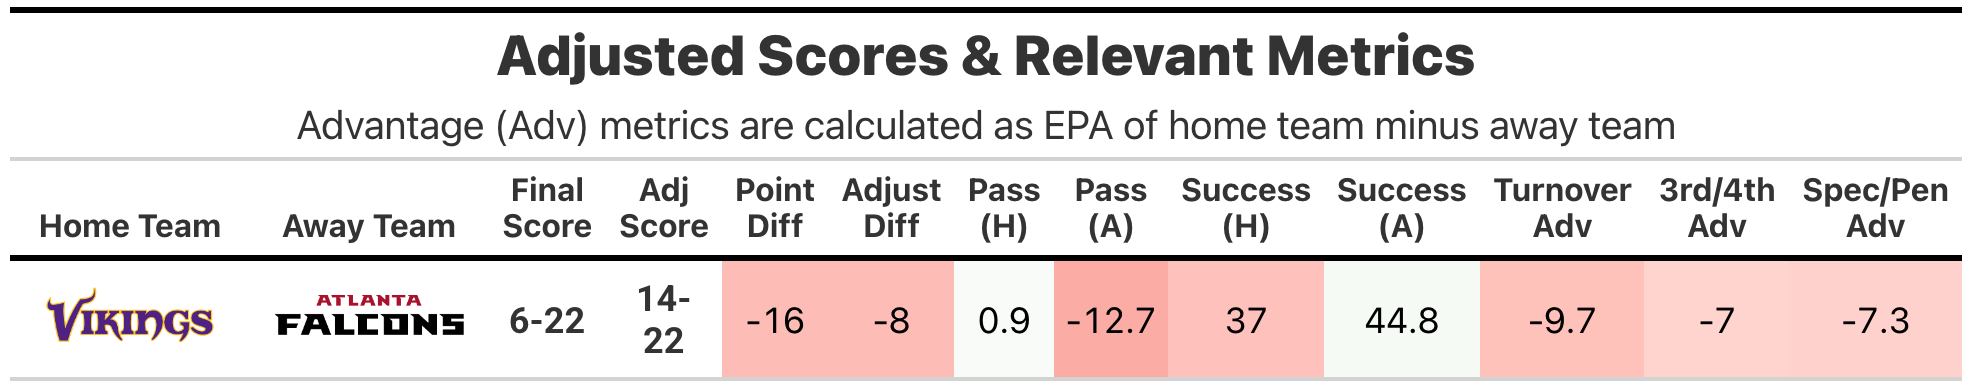
The story of the game was an Atlanta Falcons defense that held the Minnesota Vikings offense to awful EPA efficiency: the 1st percentile at -0.46 per play. The Vikings offensive success rate wasn’t as bad (37%), but enormous turnover losses (three for a total of 15.6 expected points lost) crushed their dropback efficiency.
