The adjusted scores quantify team play quality, with emphasis on stable metrics (success rate) and downplaying higher variance events (turnovers, special team, penalties, fumble luck, etc). Adjusted expected points added (EPA), in conjunction with opportunity-based metrics like total plays and drives, projects adjusted points. Adjusted scores have been tested against actual scores and offer slightly better predictive ability, though their primary benefit is explanatory.
All 2025-2022 and historical Adjusted Scores and other site metrics are available in a downloadable format to paid subscribers via Google Sheet.
Find previous advanced reviews here
** Adjusted Scores table:
“Pass” - Pass rate over expectation (based on context of each play and historical averages
“Success” - Success rate on offense, a key metric in adjusted score vs actual
“H & A” - Home or away team
Buccaneers (-8.5) vs Browns

The Cleveland Browns pulled off the biggest upset of the early window (data was slow so I loved this write-up to the late window), traveling to face the Tampa Bay Buccaneers, in a matchup of intrigue due to the starting quarterbacks.
The Bucs slightly outgained the Browns (313 yards to 267), and had a 16-6 lead midway through the third quarter. But they couldn’t get anything going in the dropback passing game, posting a 10th percentile efficiency.
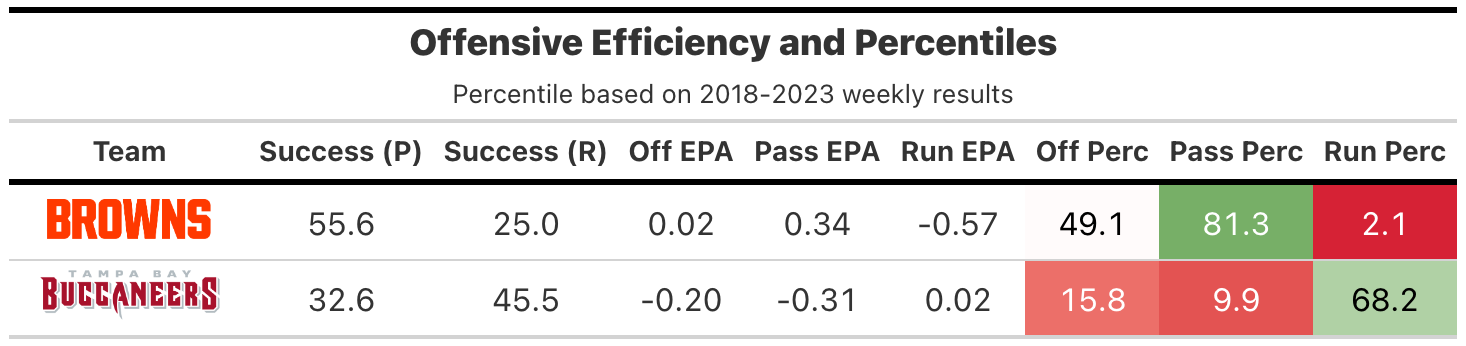
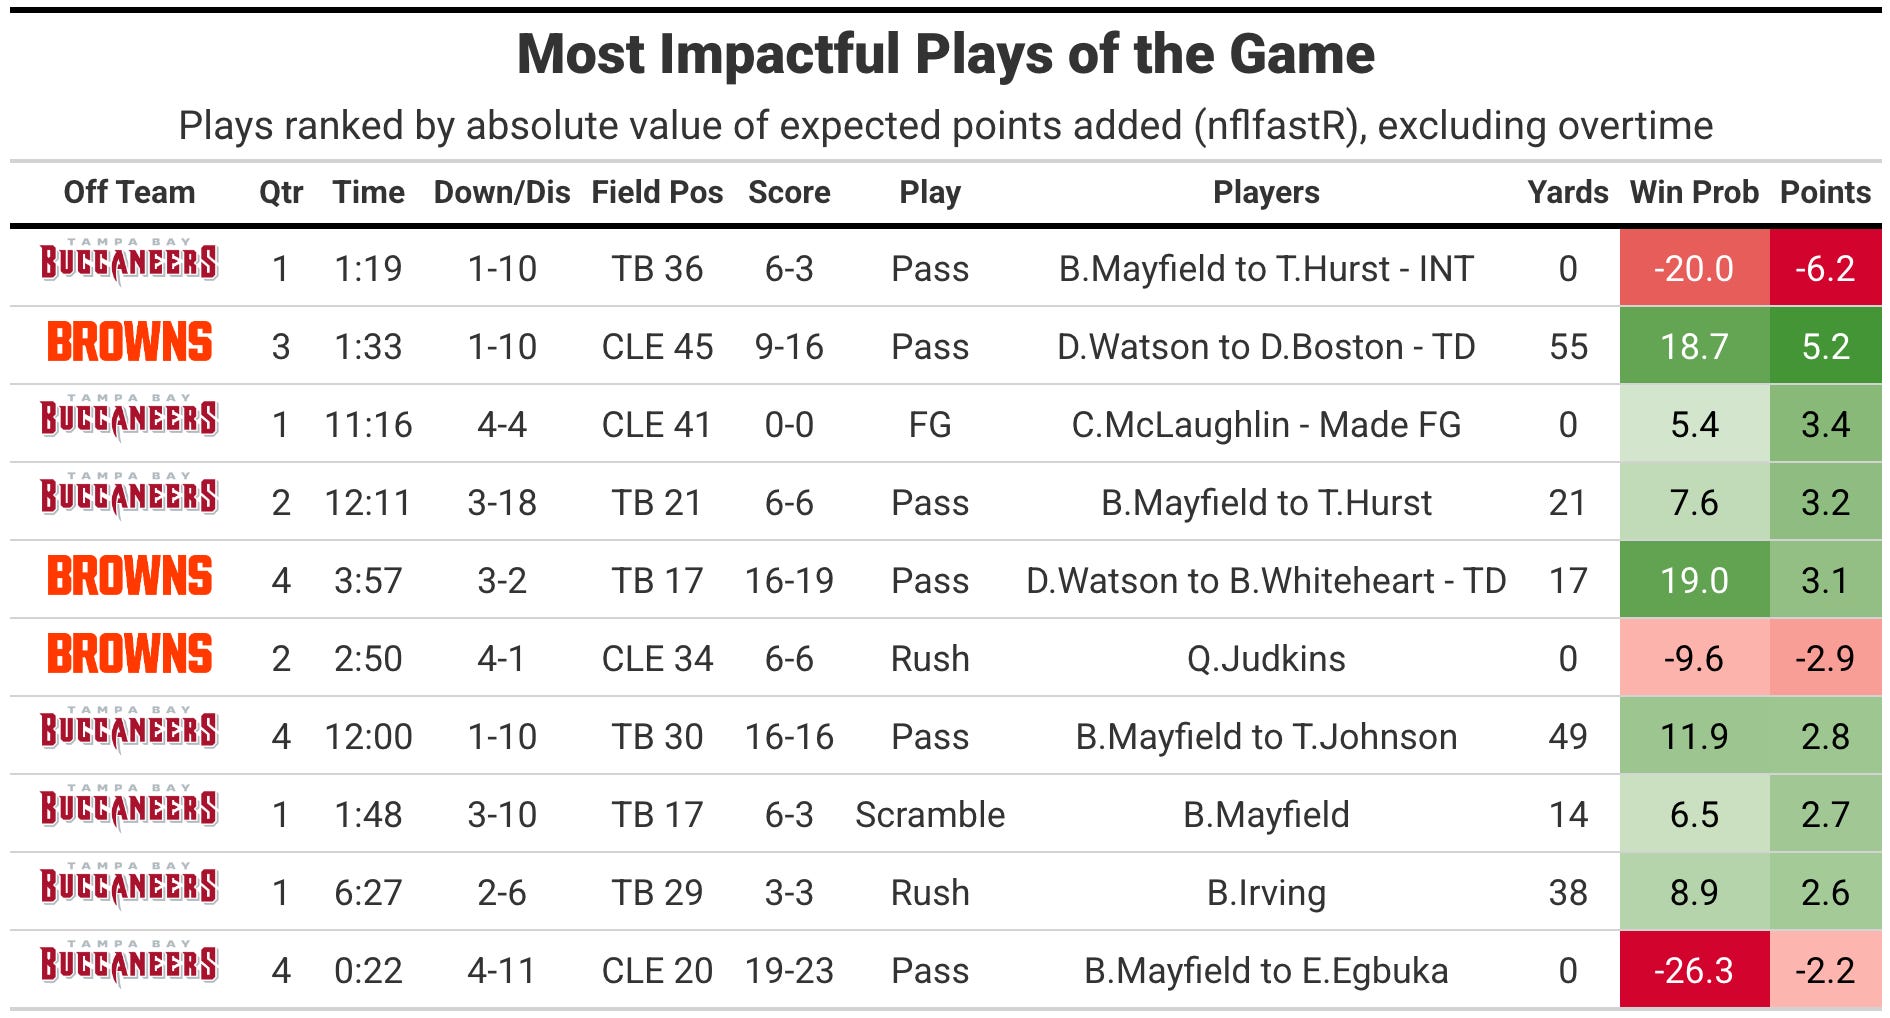
The Browns were even worse running the ball than the Bucs were passing, but, surprisingly, Deshaun Watson was able to conduct a more than passable dropback game. The biggest positive play was a 55-yard touchdown by Denzel Boston, where he improbably broke a few tackles and ran 42 yards after the catch.
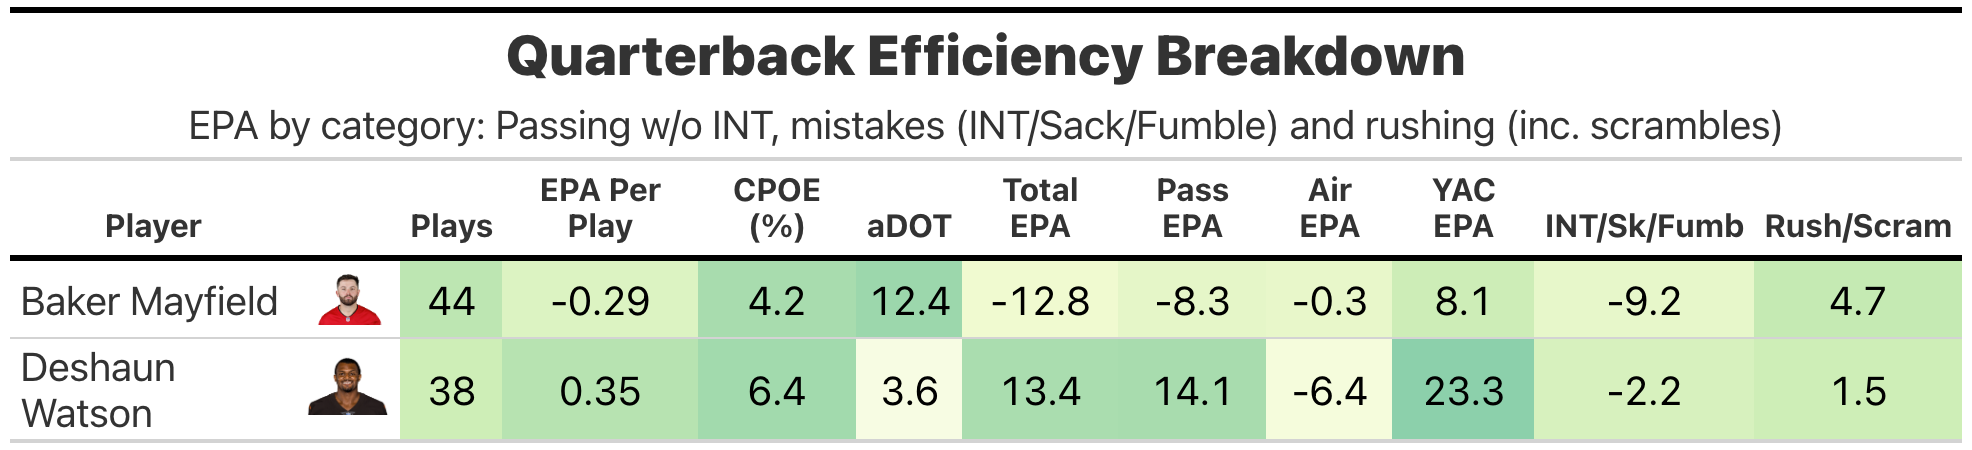
The adjusted efficiency numbers will discount Watson’s efficiency for his reliance on receiver YAC, but he still should have good numbers after adjustment.
Mayfield only averaged 5.4 YPA, passing for 182 yards on 34 attempts.