

Week 13 Early Window: Advanced Reviews
All the advanced stats, visualizations & commentary for Panthers-Rams, Brown-49ers, Colts-Texans, Dolphins-Saints, Jets-Falcons, Bucs-Cardinals & Titans-Jaguars

The adjusted scores quantify team play quality, with emphasis on stable metrics (success rate) and downplaying higher variance events (turnovers, special team, penalties, fumble luck, etc). Adjusted expected points added (EPA), in conjunction with opportunity-based metrics like total plays and drives, projects adjusted points. Adjusted scores have been tested against actual scores and offer slightly better predictive ability, though their primary benefit is explanatory.
All 2025-2022 and historical Adjusted Scores and other site metrics are available in a downloadable format to paid subscribers via Google Sheet.
Find previous advanced reviews here
** Adjusted Scores table:
“Pass” - Pass rate over expectation (based on context of each play and historical averages
“Success” - Success rate on offense, a key metric in adjusted score vs actual
“H & A” - Home or away team
CAR vs LA (-10)
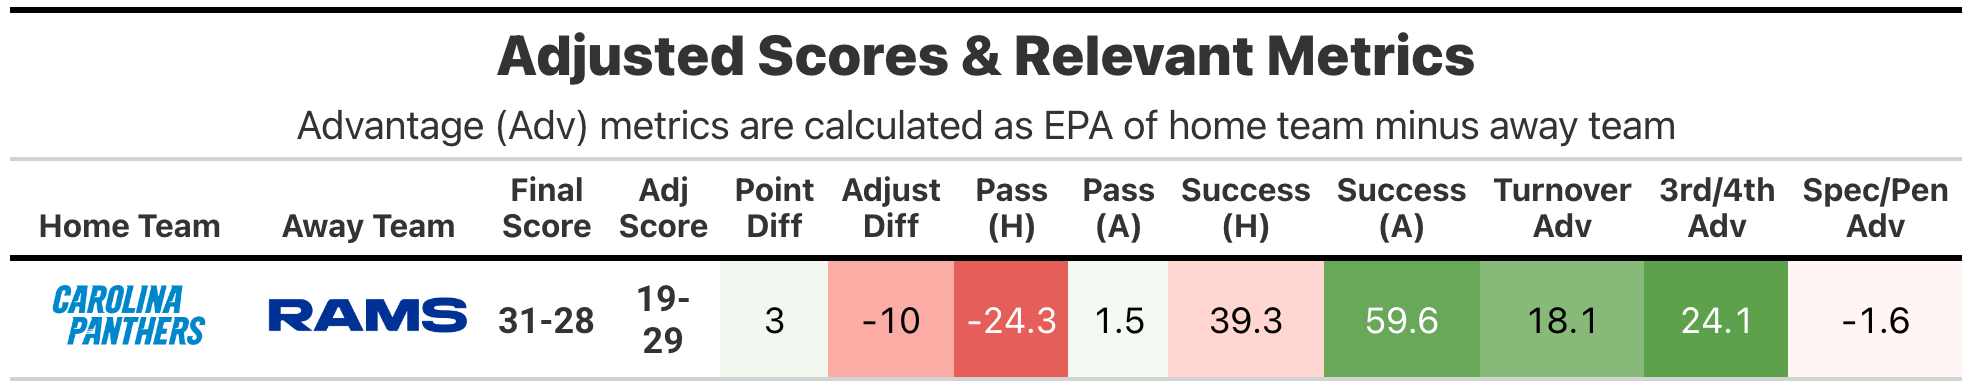
This has to be the biggest, or approaching the biggest swing between actual and adjusted scores, with the Carolina Panthers winning the game by three points, and the fundamentals pointing to the Los Angeles Rams being 10 points better.
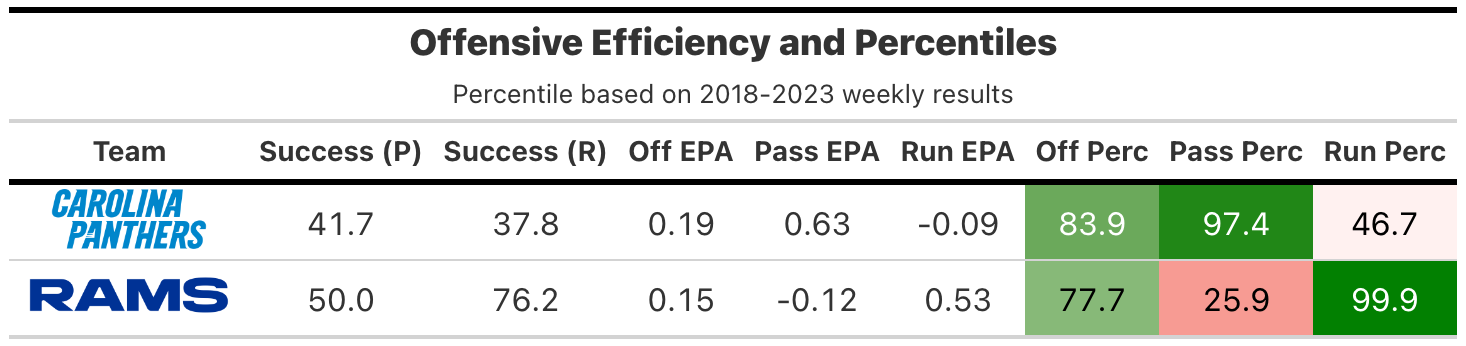
The headline difference comes in offensive success rate, with the Rams gaining expected points on an awesome 60% of plays, whereas the Panthers were below 40%. The Panthers ended up with slightly higher offensive EPA efficiency (84th percentile to 78th) due to a +3 turnover margin (+18.1 EPA) driving down the Rams offense and going 3-for-3 on fourth downs (+13.2 EPA).
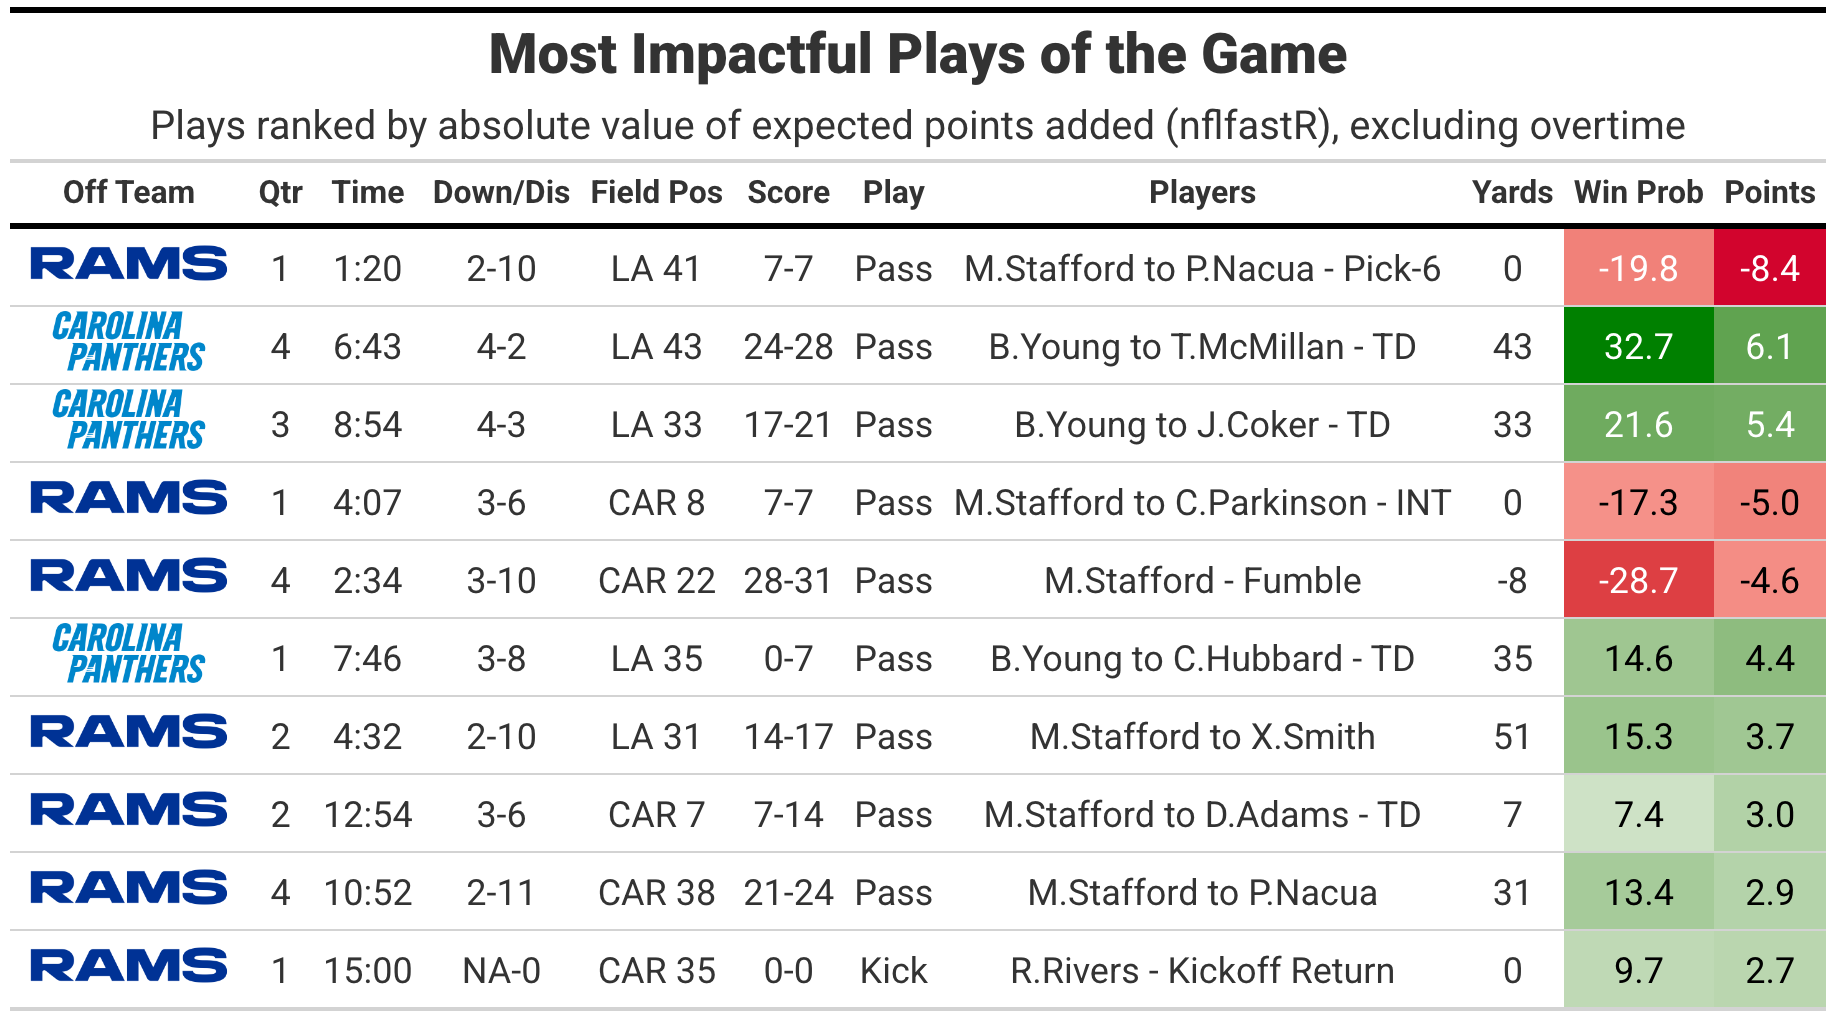
One of those Rams turnovers was a pick-6 registering as the biggest value swing of the game at a loss of -8.4 expected points. The Panthers got a number of big plays on late downs, including 43- and 33-yard touchdowns on fourth downs, plus a 35-yard scores on 3rd & 8. The Panthers were 7-for-15 on third downs (+5.0 EPA) versus the Rams at 2-for-5 (-5.9).
The Panthers ability to extend drives allowed them to run 11 more plays, despite averaging 5.8 yards per play to the Rams at 7.4. The Rams were in the red zone six times this game, whereas the Panthers were there only once, relying on longer scores. The Panthers were able to generate a number of big pass plays, despite focusing heavily on the run, with 37 designed runs to only 24 dropbacks (39.3% pass rate, -24.3% over expectation).
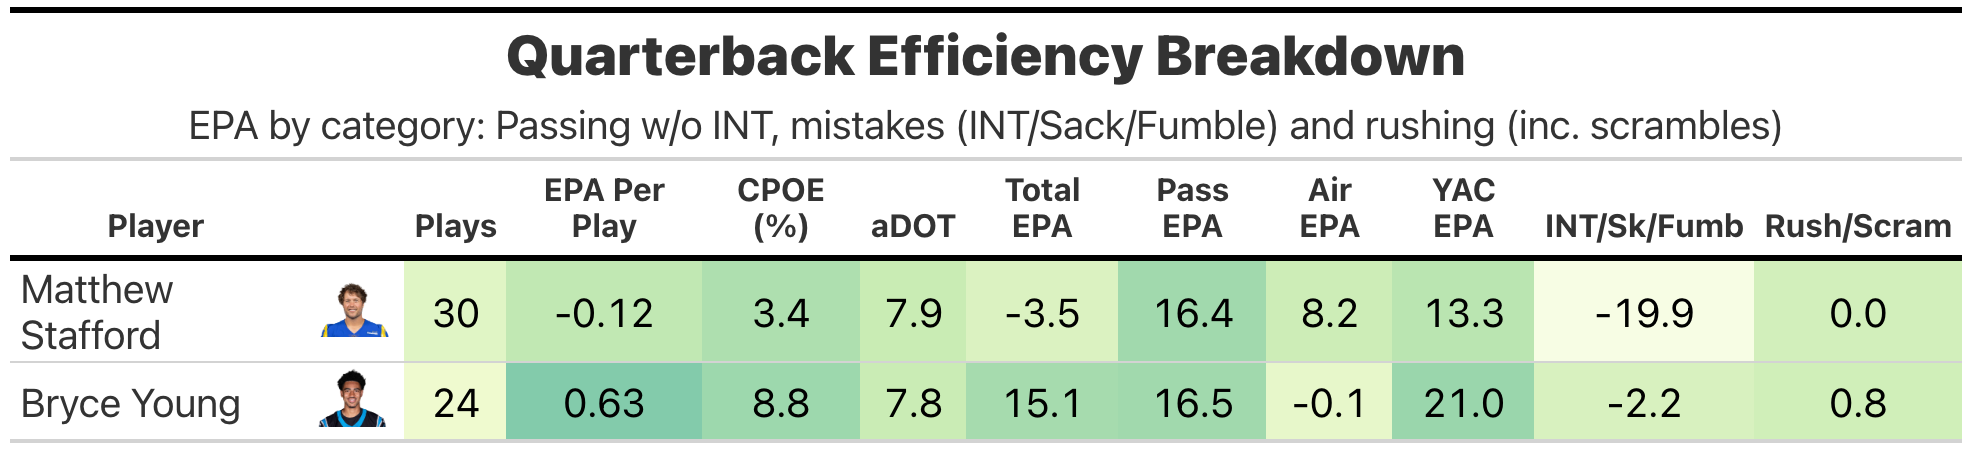
A lightly used Bryce Young posted an outstanding +0.63 EPA per play, completing 15 of 20 attempts for 206 yards and three long touchdowns. Young’s adjusted numbers will get knocked a bit for needing big YAC gains.
Simply too many big turnovers for Matthew Stafford, but it shows that he was very productive outside of those negatives to almost get back to flat value on the day. The loss makes the Rams’ path to the No. 1 seed a little trickier, now tied with the Chicago Bears at 9-3 and the 8-3 Seattle Seahawks are currently playing (and dominating). The Rams did defeat the Seahawks in their first of two regular season matchups.
CLE vs SF (-5.5)
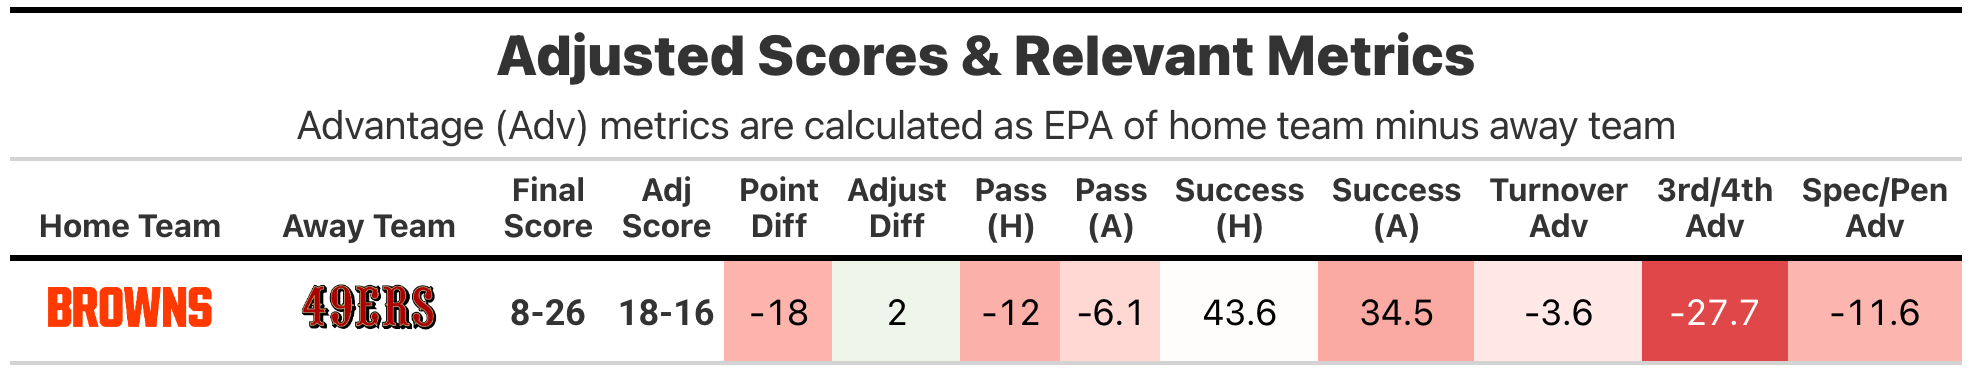
We have another flip between actual and adjusted scores, this time going from a dominant-looking 26-8 final line for the San Francisco 49ers to the fundamentals saying the Cleveland Browns were slightly better.
The 49ers were able to turn a subpar 34.5% offensive success rate into average EPA efficiency, and the Browns had a respectable 43.6% success rate discounted to 13th percentile efficiency. Those movements were largely based on late-down performance, with the 49ers going 11-for-17 on third down (+10.3 EPA) and the Browns at 3-for-11 (-6.0). On fourth downs, the Browns were 0-for-4 (-11.4).
