


The adjusted scores quantify team play quality, with emphasis on stable metrics (success rate) and downplaying higher variance events (turnovers, special team, penalties, fumble luck, etc). Adjusted expected points added (EPA), in conjunction with opportunity-based metrics like total plays and drives, projects adjusted points. Adjusted scores have been tested against actual scores and offer slightly better predictive ability, though their primary benefit is explanatory.
All 2022-2026 and historical Adjusted Scores and other site metrics are available in a downloadable format to paid subscribers via Google Sheet.
Find previous advanced reviews here
Unexpected Points is a reader-supported publication. To receive new posts and support my work, consider becoming a free or paid subscriber.
** Adjusted Scores table:
“Pass” - Pass rate over expectation (based on context of each play and historical averages
“Success” - Success rate on offense, a key metric in adjusted score vs actual
“H & A” - Home or away team
Texans (-12.5, 84%) vs Colts

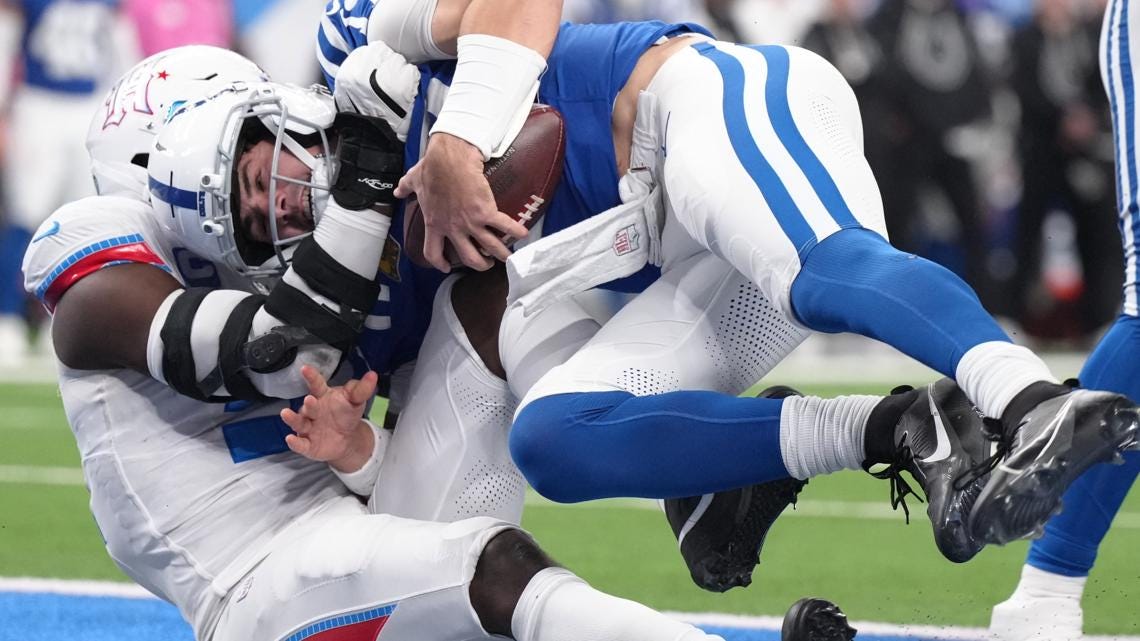
The Houston Texans (4-6) cruised past the Indianapolis Colts (3-8) 26-3, though the adjusted scores saw a less lopsided game (20-10, 10-point differential). The Texans had a 45% success rate, up from 43% coming in, while the Colts managed just 28%, down from 42%. The Texans defense had been a bit of a disappointment this season into the game, with roughly league-average efficiency, but was dominant in this contest.
Special teams account for a decent portion of the gap between the final and adjusted scores. The Colts lost 6.6 expected points on special teams, mostly on two missed Spencer Shrader field goals: a 56-yard try that went wide left with the Colts up 3-0 late in the first quarter (-2.6 EPA, -4.0% win probability) and a 62-yard attempt that was blocked with 2:49 left in the first half (-1.8 EPA).
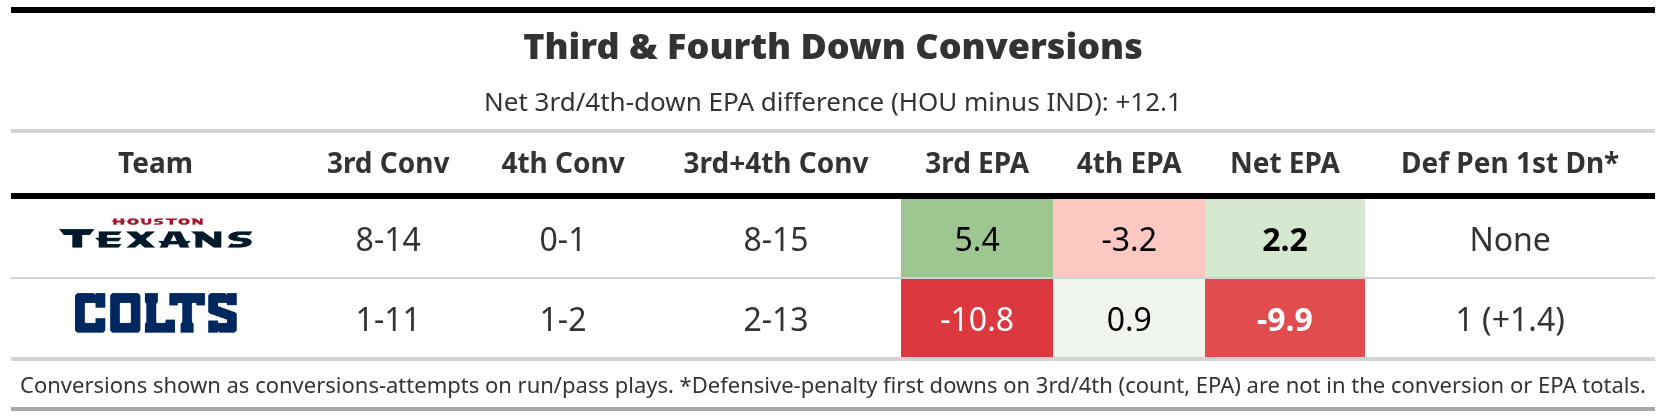
Late-down differential was an even bigger factor. The Colts only converted 1 of 11 third downs, losing 10.8 expected points, while the Texans converted 8 of 14 (+5.4 EPA).
The Texans’ only fourth-down try came with a 26-3 lead in the fourth quarter: a C.J. Stroud run on fourth-and-1 from the Colts’ 35 lost 4 yards and 3.2 expected points, the game’s largest EPA-swing play, but having no effect on win probability.

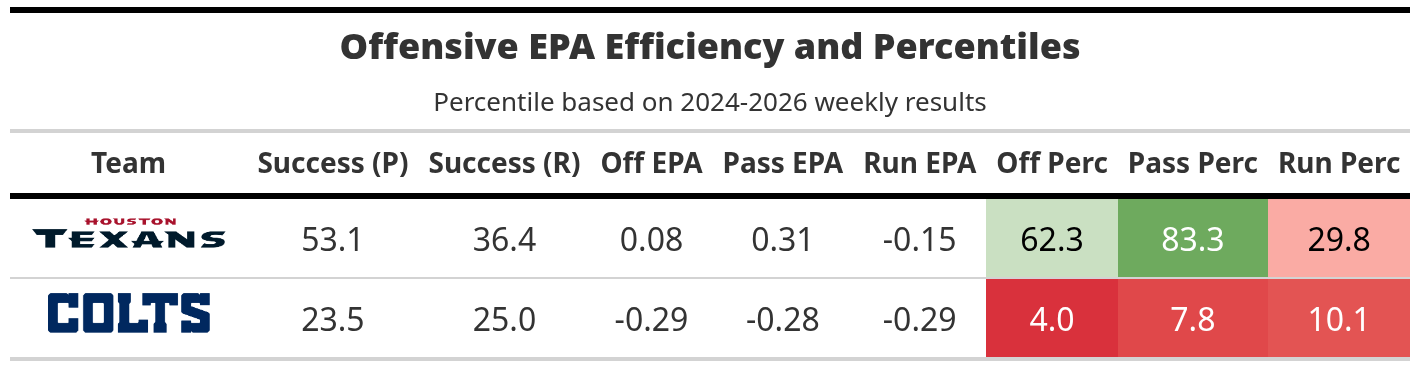
The Texans outgained the Colts 355-167. The Colts averaged 3.5 yards per play (5th percentile), 4.1 per dropback (10th) and 2.2 per designed run (4th) on 16 designed runs to the Texans’ 33. Their 38 rushing yards tied for their fewest in any game over the last 10 seasons (163 games).
The Texans’ passing game carried their offense at +0.31 EPA per dropback (83rd percentile), while their runs were at -0.15 (30th).
Stroud’s three touchdown passes all sit among the 10 biggest EPA plays: a 42-yard score to Nico Collins on first-and-10 that put the Texans ahead for good in the first quarter (+3.0 EPA, +5.7% win probability, the game’s largest win-probability swing), a 24-yard score to Kayshon Boutte on third-and-2 (+2.7 EPA) and a 13-yard score to Marlin Klein (+2.3 EPA).