


The adjusted scores quantify team play quality, with emphasis on stable metrics (success rate) and downplaying higher variance events (turnovers, special team, penalties, fumble luck, etc). Adjusted expected points added (EPA), in conjunction with opportunity-based metrics like total plays and drives, projects adjusted points. Adjusted scores have been tested against actual scores and offer slightly better predictive ability, though their primary benefit is explanatory.
All 2025-2022 and historical Adjusted Scores and other site metrics are available in a downloadable format to paid subscribers via Google Sheet.
Find previous advanced reviews here
** Adjusted Scores table:
“Pass” - Pass rate over expectation (based on context of each play and historical averages
“Success” - Success rate on offense, a key metric in adjusted score vs actual
“H & A” - Home or away team
Bills (-16.5, 92%) vs Dolphins

The Buffalo Bills (9-1) handled the Miami Dolphins (1-9) 26-9, as expected. The adjusted scores agreed it was a comfortable win (21-8, 13-point differential). The Bills had a 42% offensive success rate, while the Dolphins managed just 22%, their lowest of the season and the second-lowest by any team in a game this season.
Josh Allen’s two interceptions put the Bills on the wrong side of the turnover battle (-4.7 EPA), but it hardly mattered. The Bills never trailed, and their win probability never dipped below 94%.
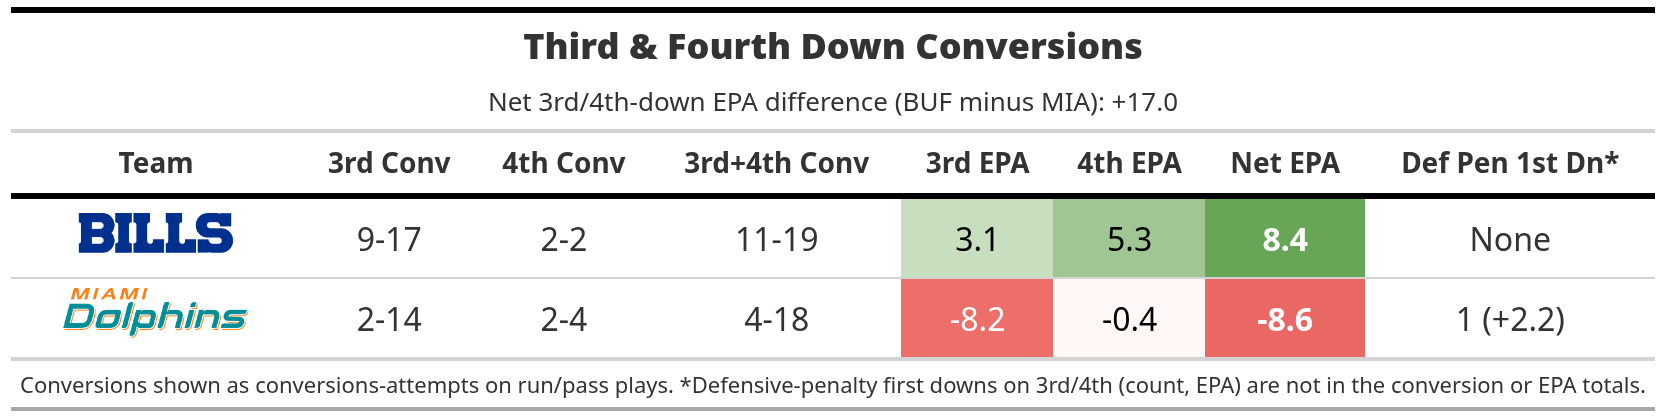
Late-down efficiency was the most significant difference. The Dolphins went 2 of 14 on third down (-8.2 EPA), while the Bills converted 9 of 17 (+3.1 EPA) and both of their fourth-down tries (+5.3 EPA), including punter Tommy Doman Jr.’s 30-yard pass to Keleki Latu on a fake punt on fourth-and-8 in the first quarter (+3.5 EPA).

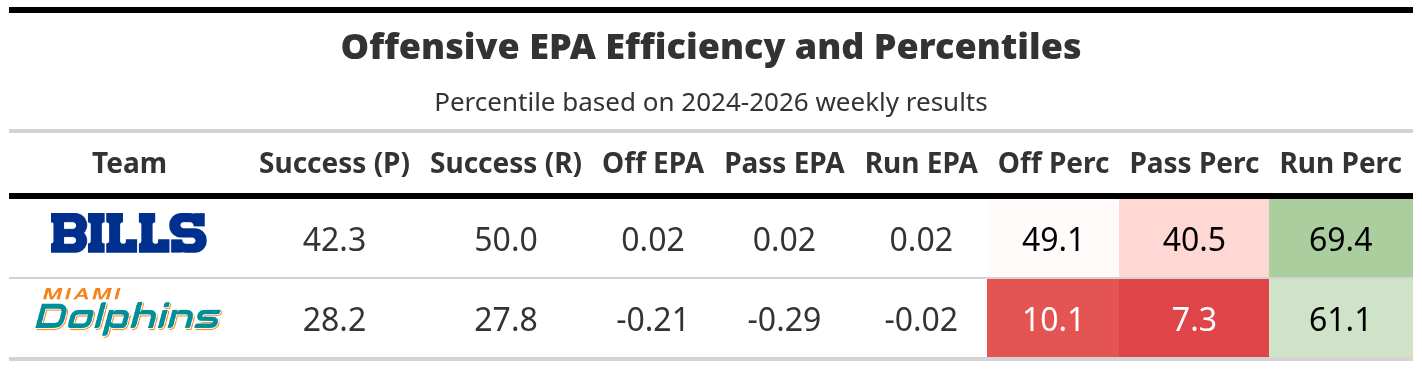
The Bills outgained the Dolphins 406-185. The Dolphins averaged 3.4 yards per play (4th percentile) and 2.6 yards per dropback (1st percentile). Their 5.0 yards per designed run (76th percentile) was the lone bright spot, but that came on just 18 designed runs.
By EPA, the Dolphins’ dropbacks were at -0.29 per play (7th percentile), with a 28% success rate.
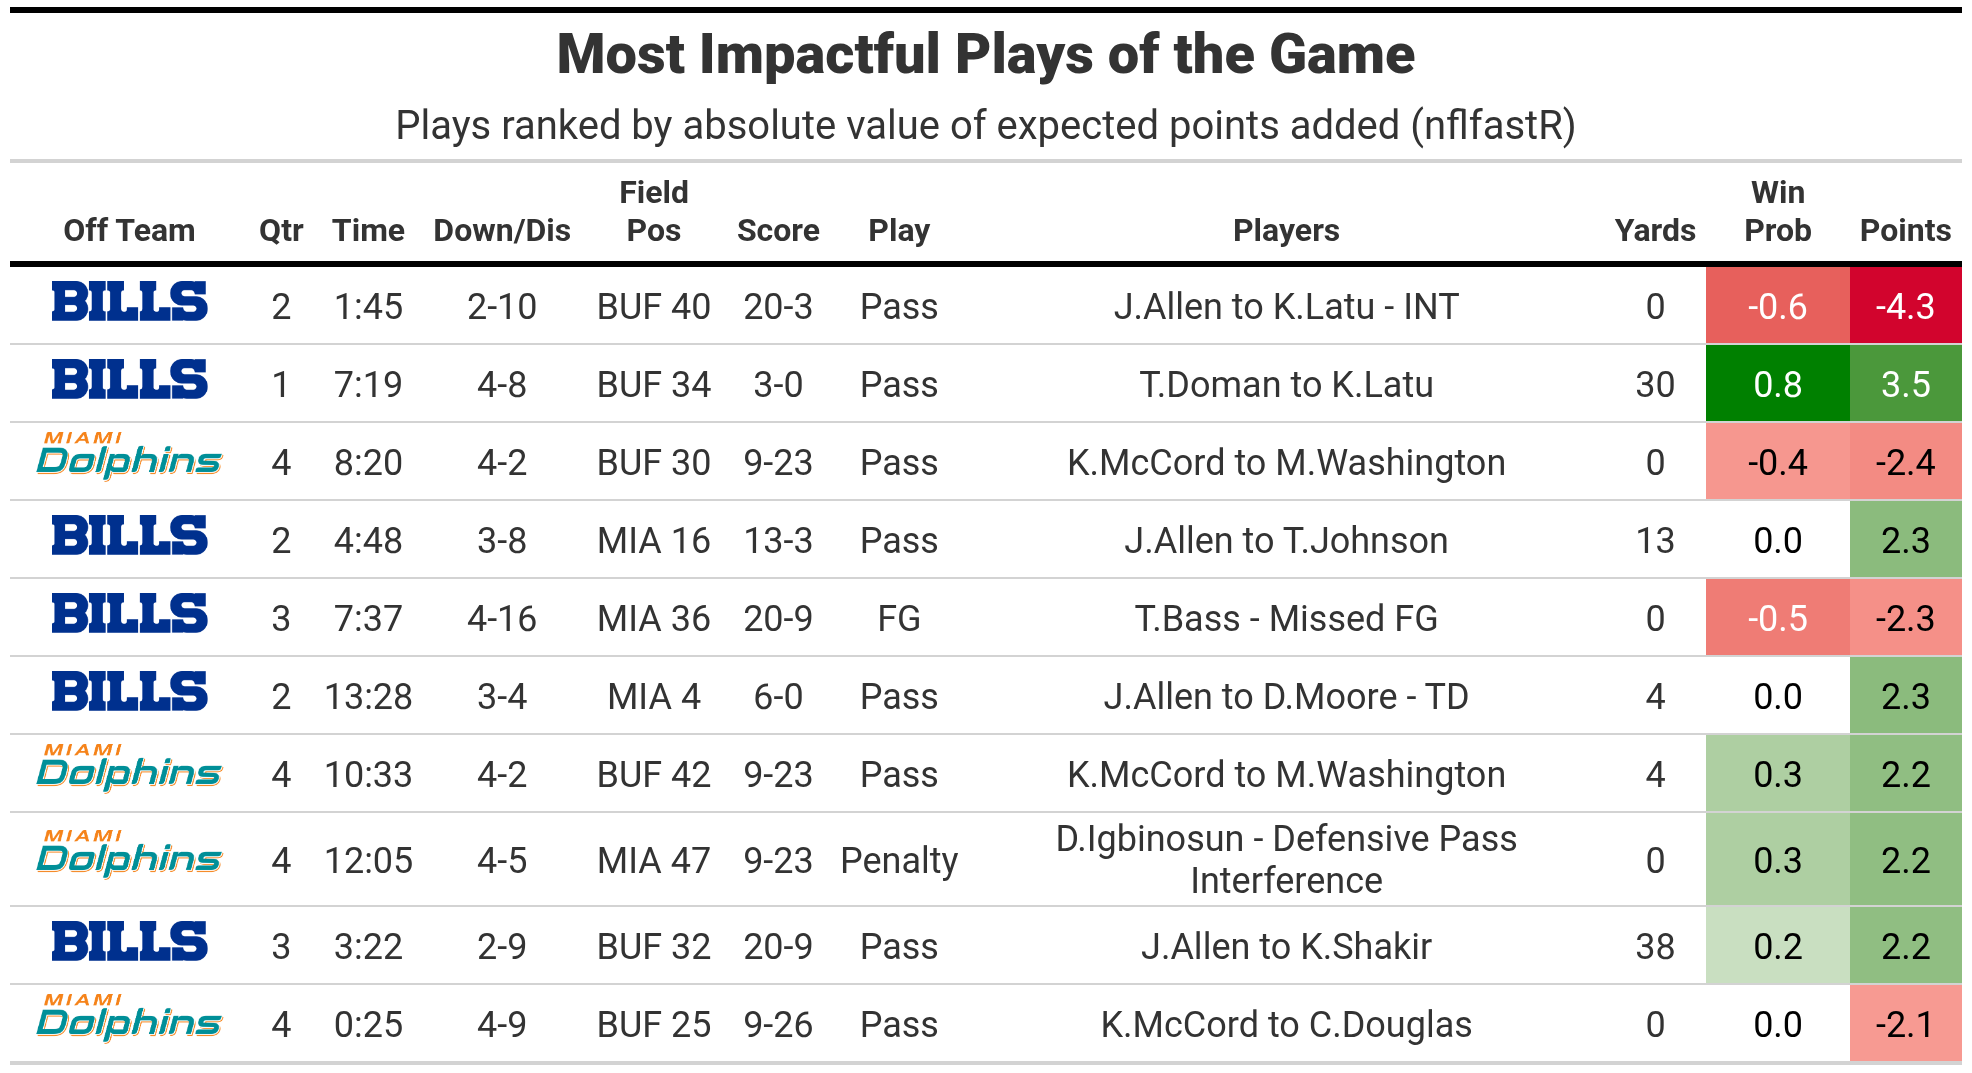
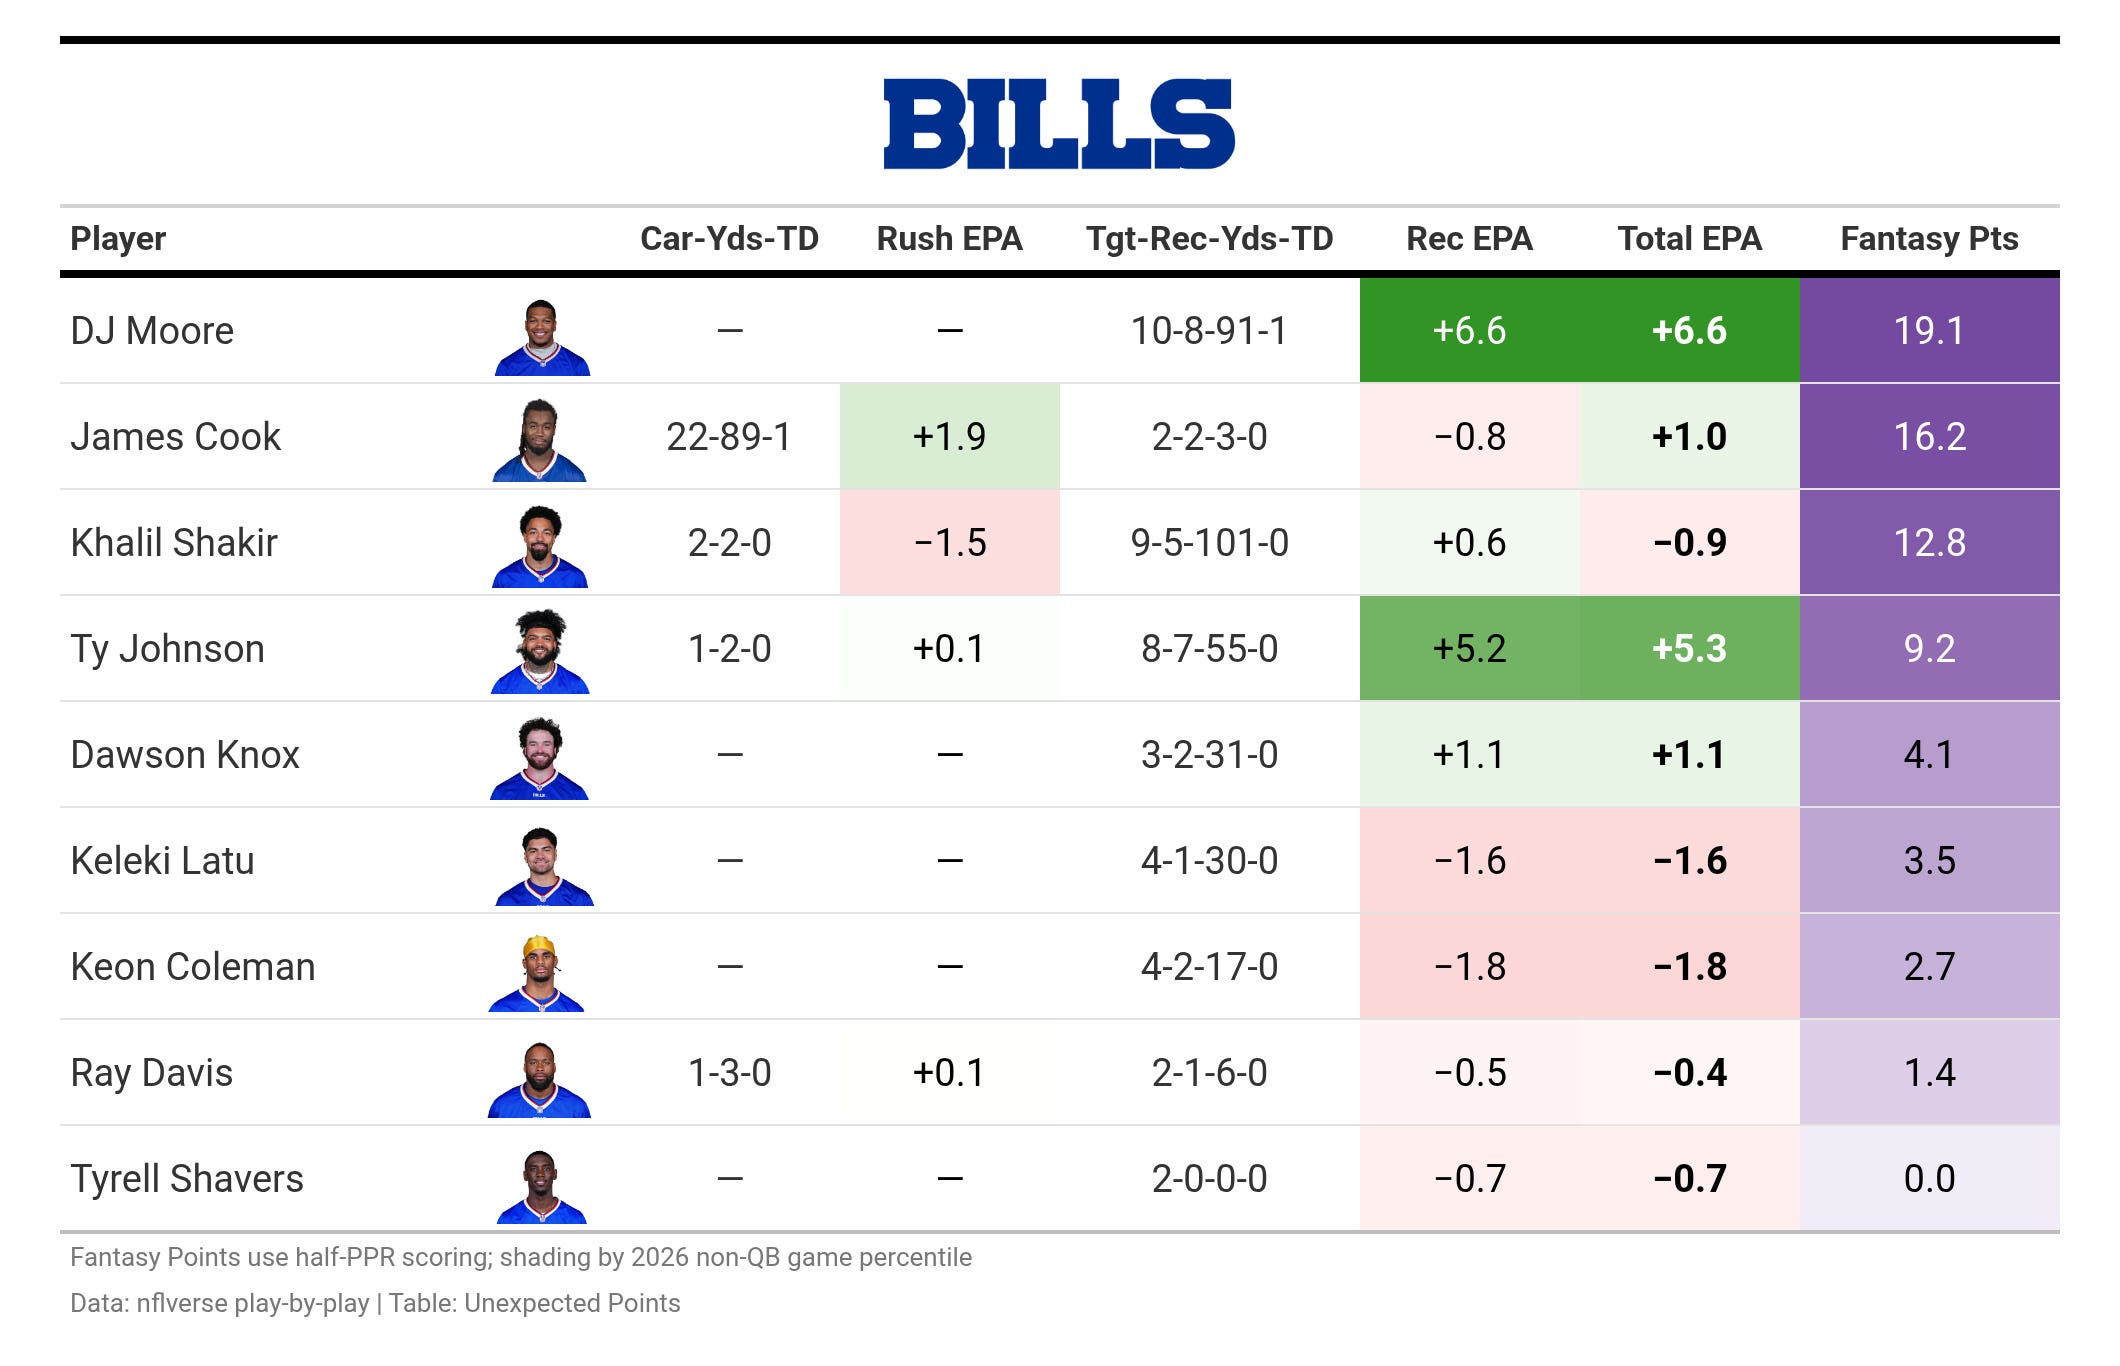
DJ Moore led all skill players at +6.6 EPA, catching eight of 10 targets for 91 yards and a touchdown. Ty Johnson added +5.3 EPA on seven catches for 55 yards. Khalil Shakir had 101 yards on five catches but was slightly negative overall (-0.9 EPA), and he was the target on Allen’s second interception.
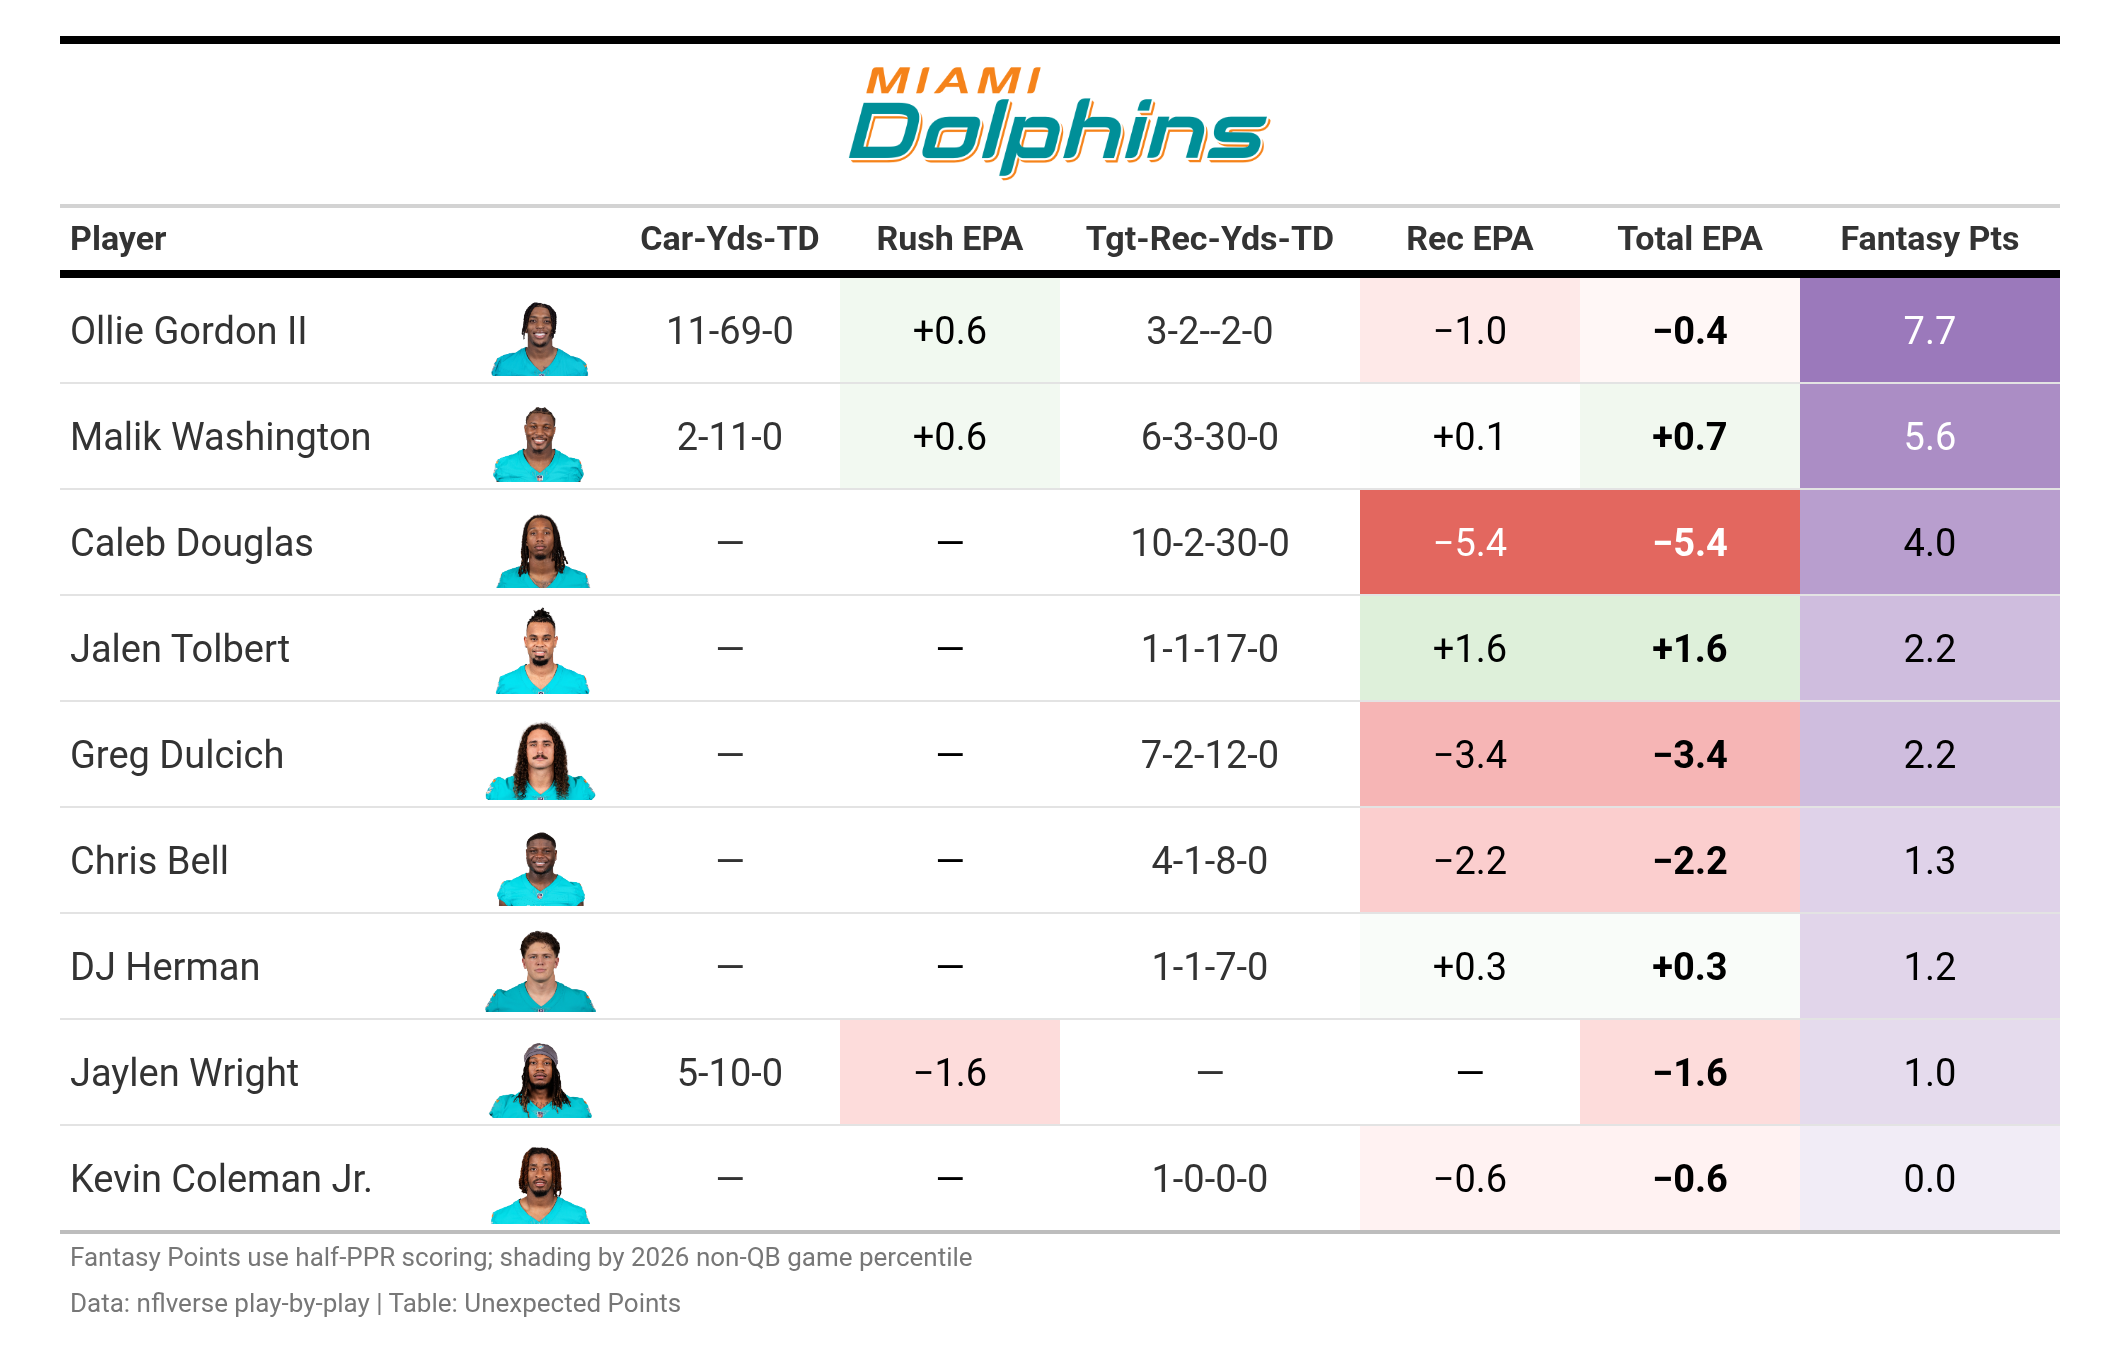
Caleb Douglas led the Dolphins with 10 targets but caught only two for 30 yards (-5.4 EPA). Ollie Gordon II ran 11 times for 69 yards (+0.6 rushing EPA).
Josh Allen had a mediocre day by his standards (-0.05 EPA per play). His passing value was positive(+7.8 EPA), but two interceptions and three sacks taken cost the Bills 10.3 expected points, and his -4.4% CPOE was well below his 1.7% for the season. The game dropped him from fourth to sixth in EPA per play among quarterbacks with at least 175 dropbacks.
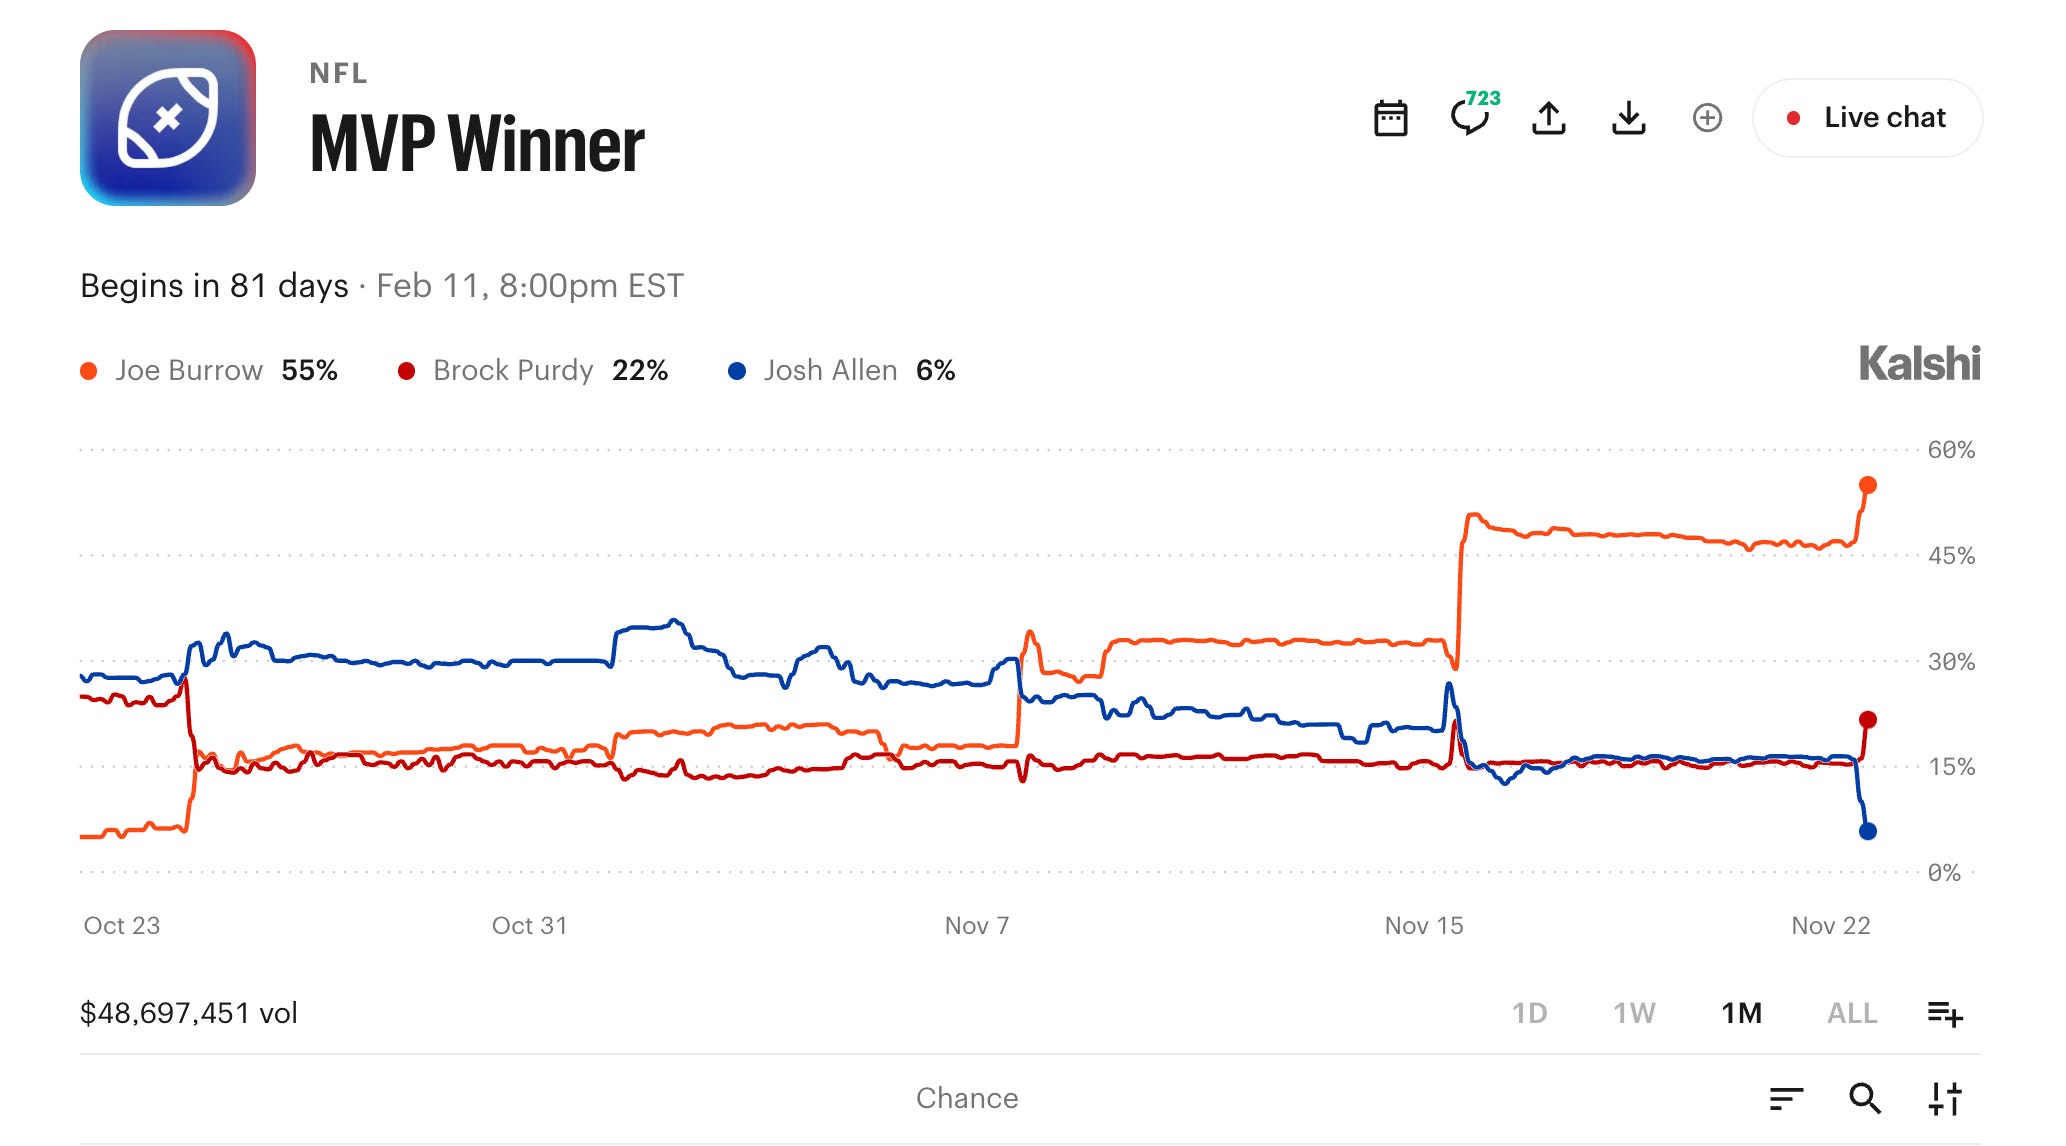
Allen’s MVP chance has fallen all the way to 6% with lackluster performance in recent weeks.
Kyle McCord struggled badly in his second start, completing 12 of 33 passes for 102 yards with a -26.4% CPOE. His passing lost 7.1 expected points even before his interception and sacks taken, leaving him at -0.29 EPA per play.

