


The adjusted scores quantify team play quality, with emphasis on stable metrics (success rate) and downplaying higher variance events (turnovers, special team, penalties, fumble luck, etc). Adjusted expected points added (EPA), in conjunction with opportunity-based metrics like total plays and drives, projects adjusted points. Adjusted scores have been tested against actual scores and offer slightly better predictive ability, though their primary benefit is explanatory.
All 2022-2026 and historical Adjusted Scores and other site metrics are available in a downloadable format to paid subscribers via Google Sheet.
Find previous advanced reviews here
Unexpected Points is a reader-supported publication. To receive new posts and support my work, consider becoming a free or paid subscriber.
** Adjusted Scores table:
“Pass” - Pass rate over expectation (based on context of each play and historical averages
“Success” - Success rate on offense, a key metric in adjusted score vs actual
“H & A” - Home or away team
Giants (-1.5, 55%) vs Commanders

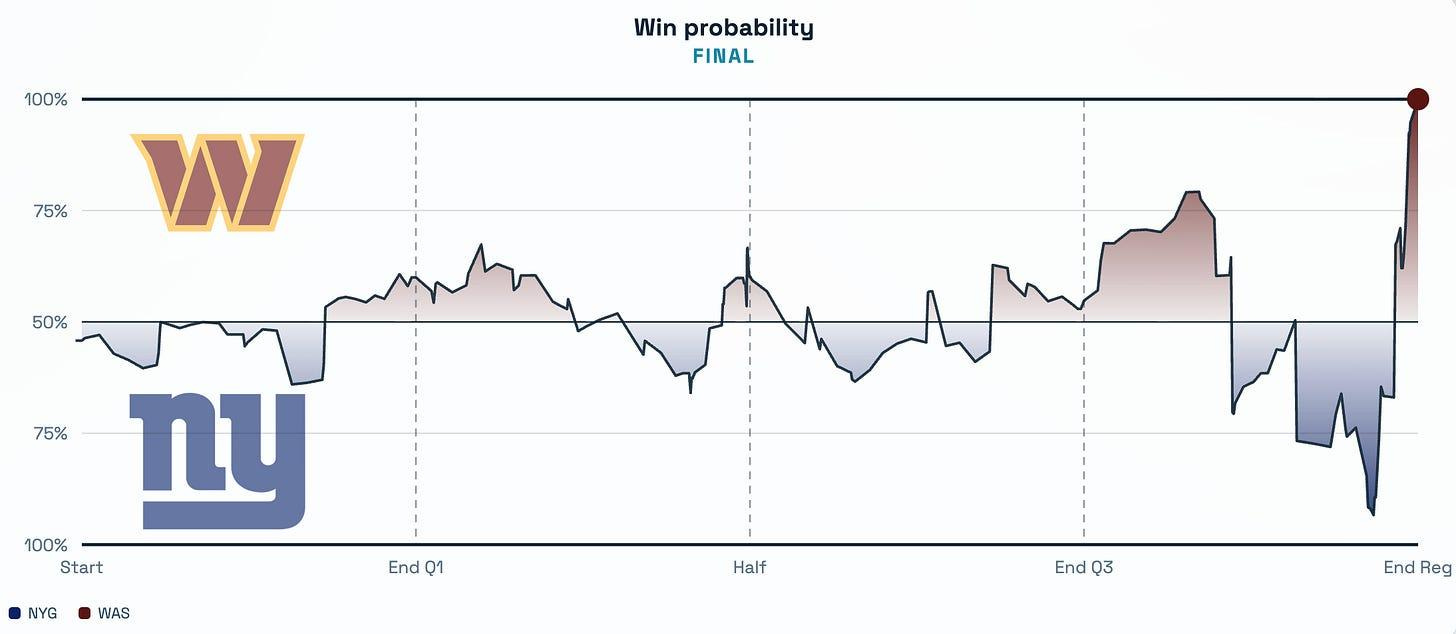
The Giants were only 1.5-point favorites (55% WP) going into the game, despite playing at home and having a three-game lead in the standings. But I guess the markets were correct in their team-strength assumptions, as the Washington Commanders (3-5-1) beat the New York Giants (5-3-1) 24-21 in a wild finish, and the adjusted scores give the Commanders a slightly bigger edge of about five points.
Both offenses were fundamentally a bit better than their teams’ final scores. The Commanders posted a 55% success rate, well above its 41% average in 2026, while the Giants were at 43% versus a 41% average.
The Giants’ win probability peaked at 93.4% with two minutes left, after Jayden Daniels’ second fourth-quarter interception at midfield. But the Commanders were able to stop the Giants and score the game-winning touchdown, needing just a little over a minute in game time.
Turnover value (Giants +1.0 EPA) and third- and fourth-down advantages (Giants +3.6) between the teams were close to even. Special teams and penalties were not: Washington had a +8.8 EPA advantage (+5.0 special teams, +3.7 penalties).
The Giants’ Dominic Zvada missed a 33-yard field goal in the first quarter (-3.3 EPA, -12.9% win probability) and later kicked off close enough to the boundary for the Commanders to draw an out-of-bounds penalty (-2.2).
Two big EPA swings set up the game-winning touchdown. The Giants’ Jordan Stout shanked a 12-yard punt out of bounds at the Washington 29 with 1:54 left (-1.3 EPA, -12.3% win probability), and Deonte Banks’ 33-yard pass interference on the next snap was worth another 12.5%.
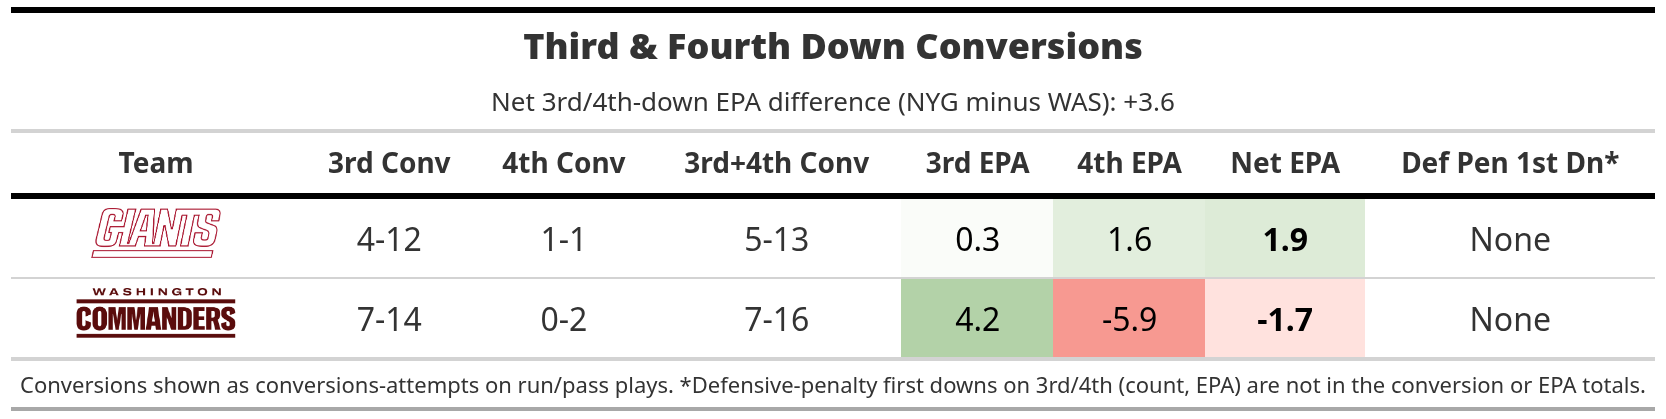
Washington converted seven of 14 third downs for +4.2 EPA, and all three of Daniels’ touchdown passes came on third down: from one yard out to Ben Sinnott with nine seconds left in the first half (+2.9 EPA, +12.8% WP), 31 yards to Antonio Williams on third-and-1 (+3.6, +11.3%), and the 32-yard game-winner to Stefon Diggs on third-and-4 with 1:05 left (+4.2, +34.4%).
Fourth down was where they gave it back and then some, going 0-for-2 for -5.9 EPA. The Giants were only 4-of-12 on third down, but their biggest play of the night came on one: a 66-yard catch-and-run by Isaiah Likely in the fourth quarter (+6.5, 34.9%).

The Giants outgained Washington 400-342 and averaged 7.8 yards per dropback (81st percentile) to the Commanders’ 6.6 (58th). Neither team ran efficiently by yardage, with the Giants at 3.8 yards per run (44th percentile) and Washington at 3.4 (30th). But both teams had better rushing EPA than yardage efficiencies.