


The adjusted scores quantify team play quality, with emphasis on stable metrics (success rate) and downplaying higher variance events (turnovers, special team, penalties, fumble luck, etc). Adjusted expected points added (EPA), in conjunction with opportunity-based metrics like total plays and drives, projects adjusted points. Adjusted scores have been tested against actual scores and offer slightly better predictive ability, though their primary benefit is explanatory.
All 2026-2022 and historical Adjusted Scores and other site metrics are available in a downloadable format to paid subscribers via Google Sheet.
Find previous advanced reviews here
Unexpected Points is a reader-supported publication. To receive new posts and support my work, consider becoming a free or paid subscriber.
** Adjusted Scores table:
“Pass” - Pass rate over expectation (based on context of each play and historical averages
“Success” - Success rate on offense, a key metric in adjusted score vs actual
“H & A” - Home or away team
Bengals (-4.5, 67%) vs Steelers

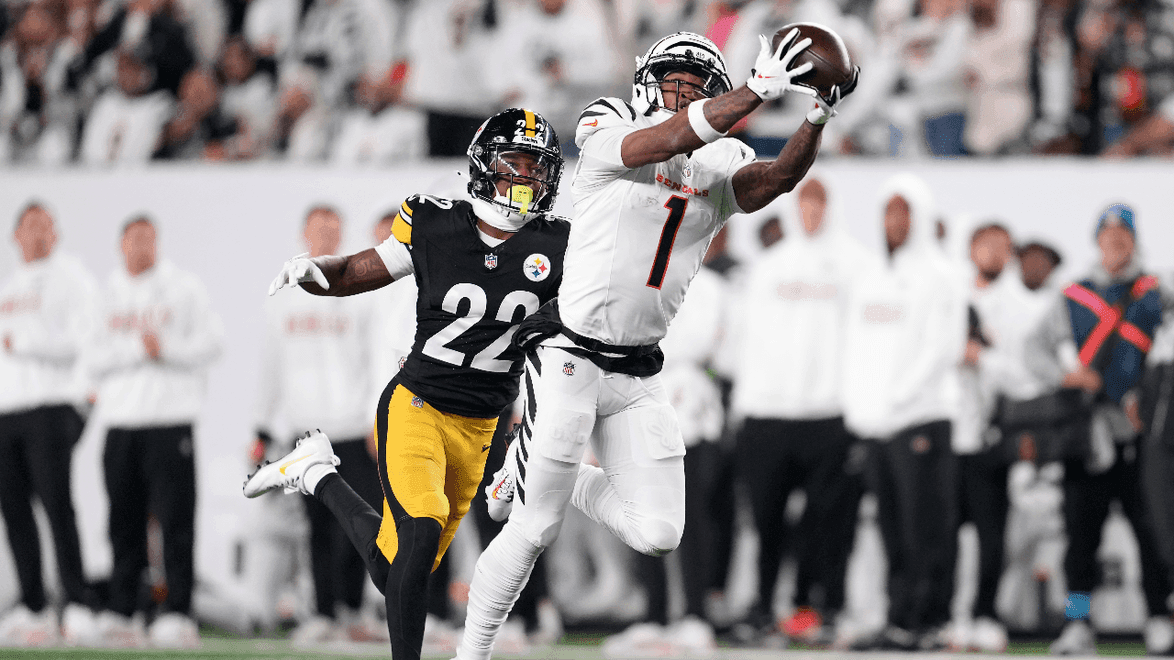
The Cincinnati Bengals (7-2) laid the smack down on the Pittsburgh Steelers (6-3) 38-18, and, amazingly, the adjusted scores saw this as an even wider victory (33-4, 29-point differential). The Bengals had an excellent 61% success rate, while the Steelers were down at only 18%, down from 44% coming in.
The Bengals never trailed, and their lowest win probability was 64.0% on the game’s first snap. They led 24-3 at halftime and 31-3 early in the fourth quarter, before the Steelers scored two touchdowns with the game already decided. The Steelers had a field goal and five punts on their first six possessions.
The Bengals had a special teams and penalty disadvantage of -8.6 EPA (special teams -6.4 EPA, penalties -2.2 EPA) but still won by 20 points. The costliest play was Evan McPherson’s 43-yard field goal that missed wide right with the Bengals up 10-0 in the second quarter (-3.8 EPA, -3.7% win probability).
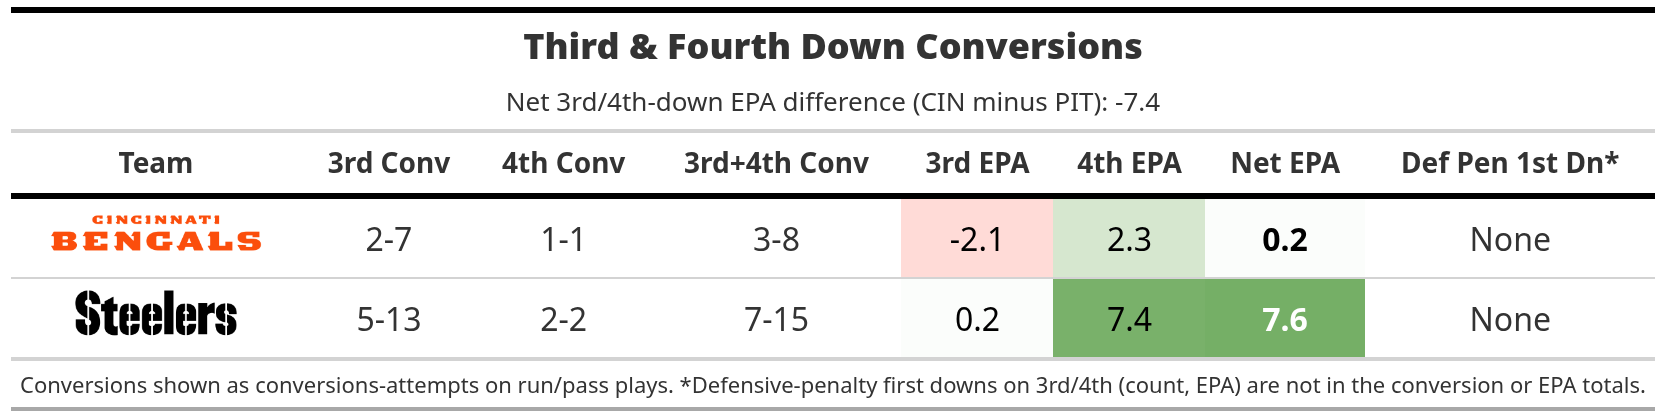
The Steelers’ +7.6 net EPA on late downs was mostly in garbage time. Aaron Rodgers’ 22-yard touchdown to DK Metcalf on fourth-and-4 came with the Steelers down 31-3 (+4.6 EPA, +0.1% win probability), and his 27-yard touchdown to Pat Freiermuth on third-and-8 came down 38-11 (+4.0 EPA).
The Bengals went just two of seven on third down (-2.1 EPA) but barely needed three downs to convert. Samaje Perine’s 1-yard run on fourth-and-1 from their own 45 in the first quarter (+2.3 EPA, +4.7% win probability) kept alive the drive that ended in their first touchdown.

The Bengals outgained the Steelers by more than 250 yards, 484-223. They averaged 7.7 yards per play (96th percentile) and 9.4 per dropback (94th), though only 3.7 per designed run (38th). The Steelers averaged 3.9 yards per play (10th percentile) and 3.6 per dropback (6th).
