Week 1 SNF Bills-Ravens: Advanced Review
The game of the year may have come in Week 1, with the Bills completing a stunning comeback
The adjusted scores quantify team play quality, with emphasis on stable metrics (success rate) and downplaying higher variance events (turnovers, special team, penalties, fumble luck, etc). Adjusted expected points added (EPA), in conjunction with opportunity-based metrics like total plays and drives, projects adjusted points. Adjusted scores have been tested against actual scores and offer slightly better predictive ability, though their primary benefit is explanatory.
All 2025-2022 and historical Adjusted Scores and other site metrics are available in a downloadable format to paid subscribers via Google Sheet.
Find previous advanced reviews here
** Adjusted Scores table:
“Pass” - Pass rate over expectation (based on context of each play and historical averages
“Success” - Success rate on offense, a key metric in adjusted score vs actual
“H & A” - Home or away team
BUF vs BAL (-1.5)
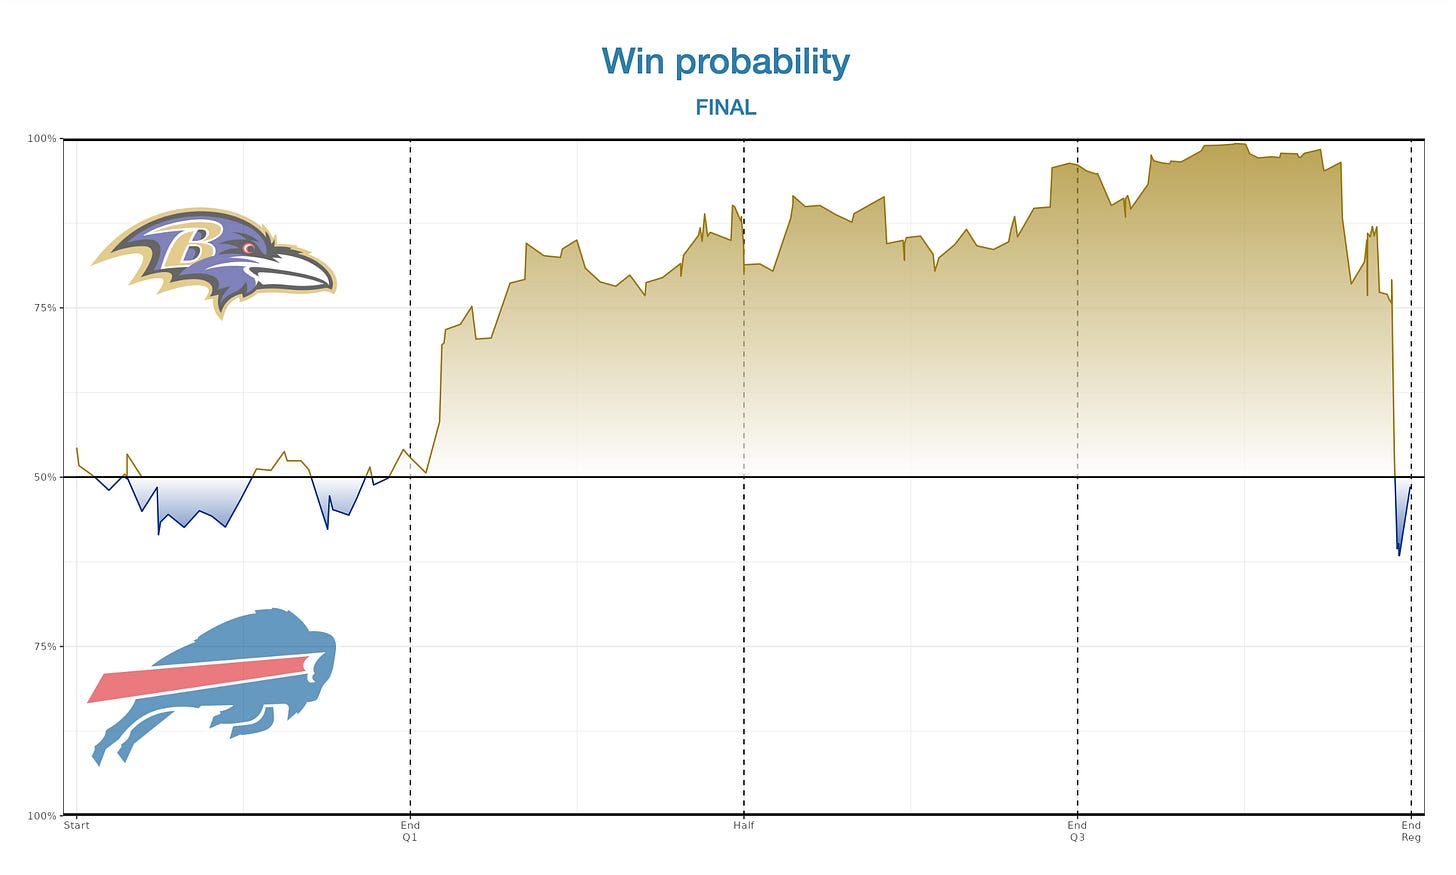
A strong contender for game of the season is already in the books, with the Buffalo Bills coming back to win at home against the Baltimore Ravens. There’s a case that win probability models can’t capture what Josh Allen and the Bills offense might be able to accomplish in a short period of time. Even so, the graph is stunning:
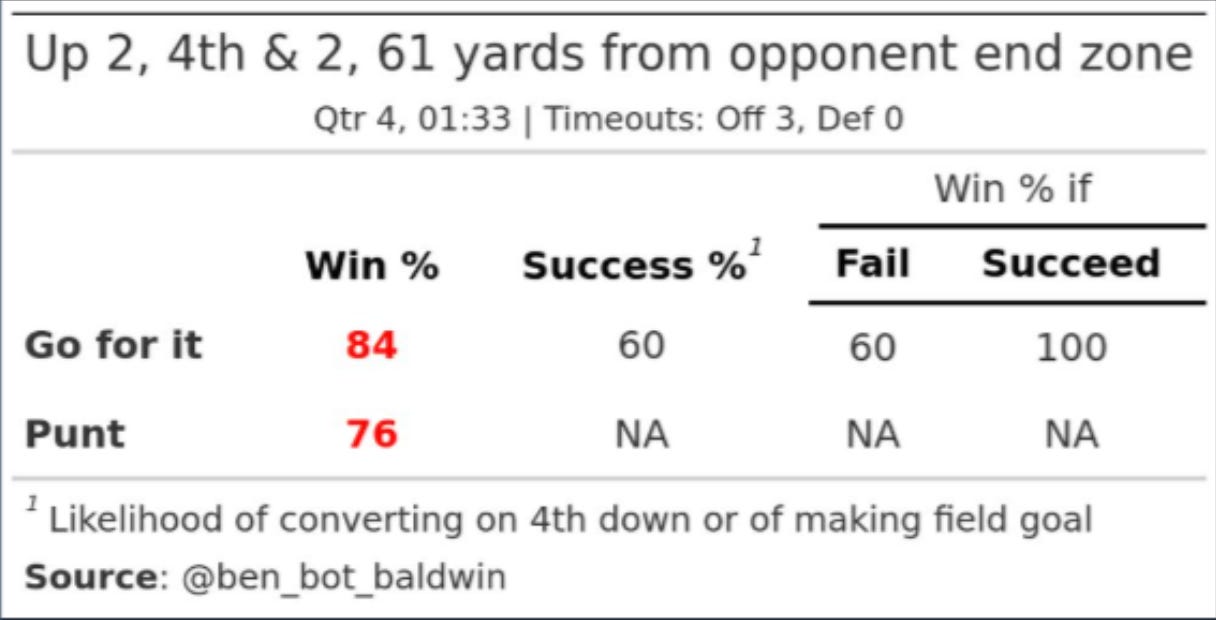
The adjusted scores have the result flipped, though ever so slightly. The Ravens posted the higher offensive success rate (52% to 49%) and even value efficiency (+0.39 EPA per play to +0.26), but the Bills still won the game. The two major factors that helped the Bills win were an extra possession (ended the first and second halves on scoring drives) and a huge Ravens turnover that opened the door. It’s also worth noting that the Ravens passed up a “very strong” go-for-it opportunity, according to the numbers, at the end of their final drive. John Harbaugh should be asked about that a lot.
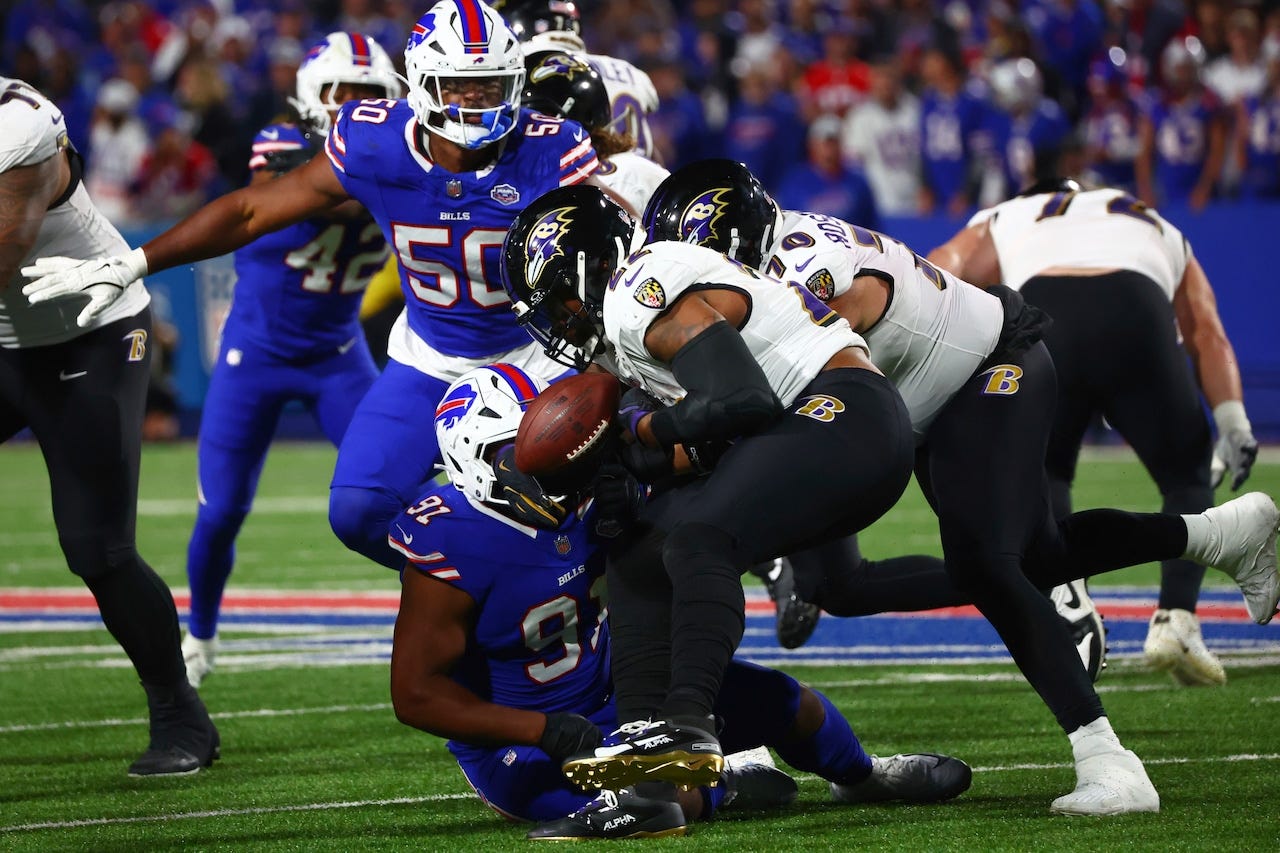
You can’t condense a game like this with outstanding offensive performances across the board down to a single play. But if you could, it would have to be Derrick Henry’s fumble with 3:10 left in the fourth quarter and the Ravens up 40-32. The win probability numbers surprisingly only show a 8.9% loss on the play (5.3 expected points loss), but the context of pre- and post-play probabilities is important. The Bills win probabilities by the nflverse model went from roughly 4% to 13%. So yes, only 9% switch, but another framing is saying that it went from the Bills winning one-out-of-25 times to better than one-out-of-eight times. In other words, three times more likely based on that one play.
Keep reading with a 7-day free trial
Subscribe to Unexpected Points to keep reading this post and get 7 days of free access to the full post archives.


