


The adjusted scores quantify team play quality, with emphasis on stable metrics (success rate) and downplaying higher variance events (turnovers, special team, penalties, fumble luck, etc). Adjusted expected points added (EPA), in conjunction with opportunity-based metrics like total plays and drives, projects adjusted points. Adjusted scores have been tested against actual scores and offer slightly better predictive ability, though their primary benefit is explanatory.
All 2026-2022 and historical Adjusted Scores and other site metrics are available in a downloadable format to paid subscribers via Google Sheet.
Find previous advanced reviews here
Unexpected Points is a reader-supported publication. To receive new posts and support my work, consider becoming a free or paid subscriber.
** Adjusted Scores table:
“Pass” - Pass rate over expectation (based on context of each play and historical averages
“Success” - Success rate on offense, a key metric in adjusted score vs actual
“H & A” - Home or away team
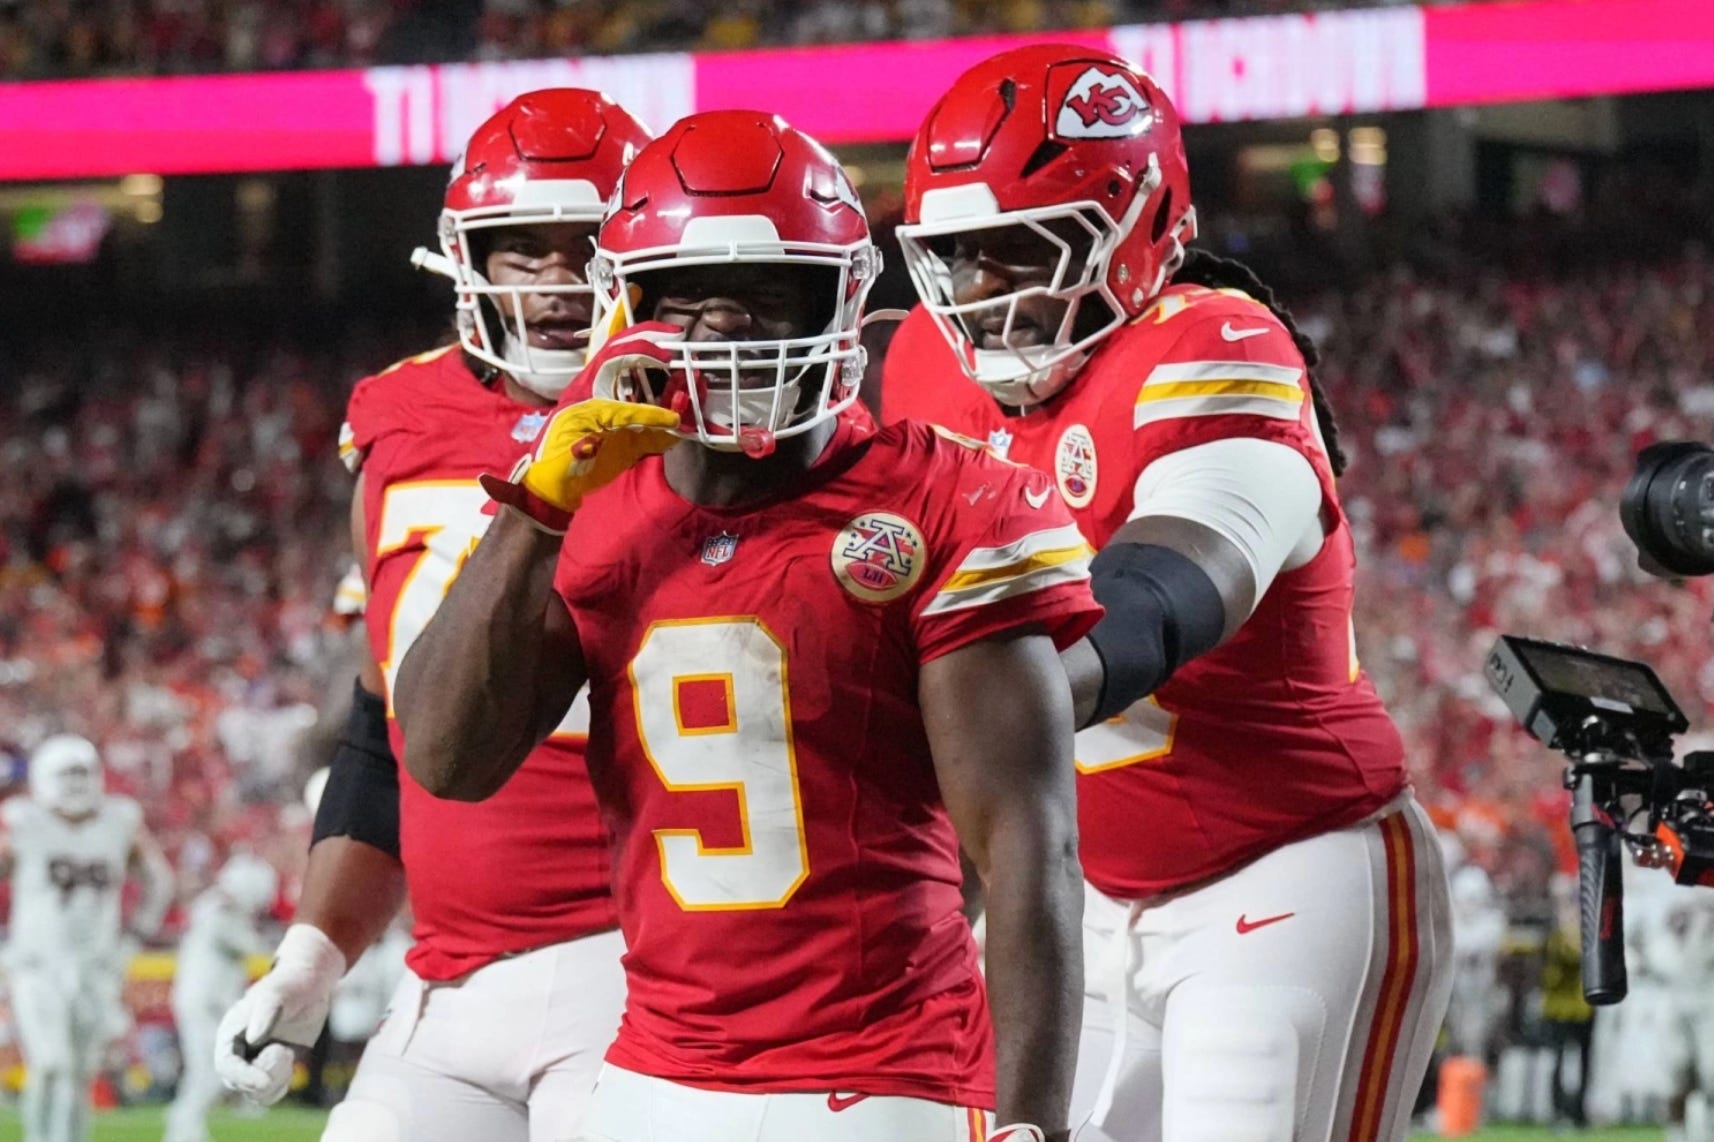
Chiefs (-2.5) vs Broncos

I wouldn’t say that the Kansas City Chiefs are “back” with a blowout win over the Denver Broncos, as their once high-flying passing offense under Patrick Mahomes wasn’t the focus, instead filling the roles of game-management and third-down conversion.
The adjusted scores have the game as being closer fundamentally than the final score, as both teams performed poorly by success rate, yet the Chiefs juiced EPA production with big plays and late-down conversions, while the Broncos were the mirror image.
