Preseason Buy/Sell Review: Week 2
Leveraging 10 years of preseason data to predict which offensive skill position rookies will outperform this season
We haven’t gotten fully through the newish three-week format for the NFL preseason, but this post covers everything through Week 2 - minus MNF (Ravens-Commanders). We have enough data at this point to do some analysis, with the necessary caveats about small sample size and avoiding overreaction well emphasized. Last week, I went through the last 10 years of preseason data to see what advanced metrics from the preseason are most highly correlated with regular season outperformance, focusing specifically on quarterbacks, running backs and wide receivers.
In this analysis, I’m going to apply the insights from historical data to the 2023 preseason, specifically for rookie performance. While the preseason doesn’t tell us a lot generally, it does appear to have more signal for how rookie play will translate to the regular season than for veterans. I’ll restate the most important metrics by position below, and detail the numbers for 2023 rookies in visual and table formats. I’ll also update this analysis a week from now when all the preseason games are officially in the books.
2023 ROOKIE QUARTERBACKS
Looking back at my historical analysis of preseason data for rookie quarterbacks, we saw that there was a correlation, especially at the higher end of performance, between preseason and regular season PFF grading. But when you split the preseason data into clean-pocket and under-pressure buckets, the former losses all translation to the regular season. The relationship appears to be entirely derived from under pressure play.
Here’s a look back at the historical relationship between preseason pressured grades and regular season overall grading.
Looking at the 2023 preseason, the plot below has clean-pocket grading on the X axis and pressured grading on the Y axis. A way to think about this would be that quarterbacks with great clean-pocket passing and poor pressured play could be overvalued coming out of the preseason, and the inverse relationship undervalued. The size of the points on the plot reflect each quarterback’s total dropbacks, which is as low as 10 (Tanner Morgan), and as high as high as 57 (Clayton Tune). The dashed lines represent the median numbers in the preseason historically.
We can see that earlier picks Will Levis, C.J. Stroud and Bryce Young performed better, by PFF grading, under pressure relative to their overall passing grades. Anthony Richardson was the reverse, but only had a paltry two pressured dropbacks (12 total) to judge. For Dorial Thompson-Robinson truthers (count me in), the data confirms priors: he was good from a clean pocket and under pressure.
The table below gives the two metrics in the plot, along with a number of other metrics of interest, if not predictive significance, for quarterbacks. The table is arranged in order of draft position, with undrafted quarterbacks excluded for simplicity.
One thing I have to note is my biggest, personal break from PFF in terms of passing grades and sacks. I would have difficulty giving Levis a pressured grade that high (73.7) when half of his eight pressures led to sacks. Levis had the second-highest preseason average time-to-throw (3.1 seconds), so he may not have fully been the victim of poor blocking. By my imprecise hand-timing, at least two of Levis’ sacks came well after four seconds passed. Further support Levis’ poor sack avoidance comes from his much larger sample of college passing, taking sacks on more than 20% of pressured dropbacks the last two seasons, a number roughly in the bottom 15th percentile.
It’s too soon to say that Anthony Richardson inaccuracy in his preseason debut (-13.2 completion percentage over expectation) was a continuation of collegiate struggles, but it’s not great. Curiously, the Indianapolis Colts chose to sit Richardson the second week of the preseason, so we not get more than 12 dropbacks to analyze for a prospect with only one season starting in college. On the positive side, Richardson got the ball out very quickly (2.17 time-to-throw), another continuation of a college trait.
2023 ROOKIE RUNNING BACKS
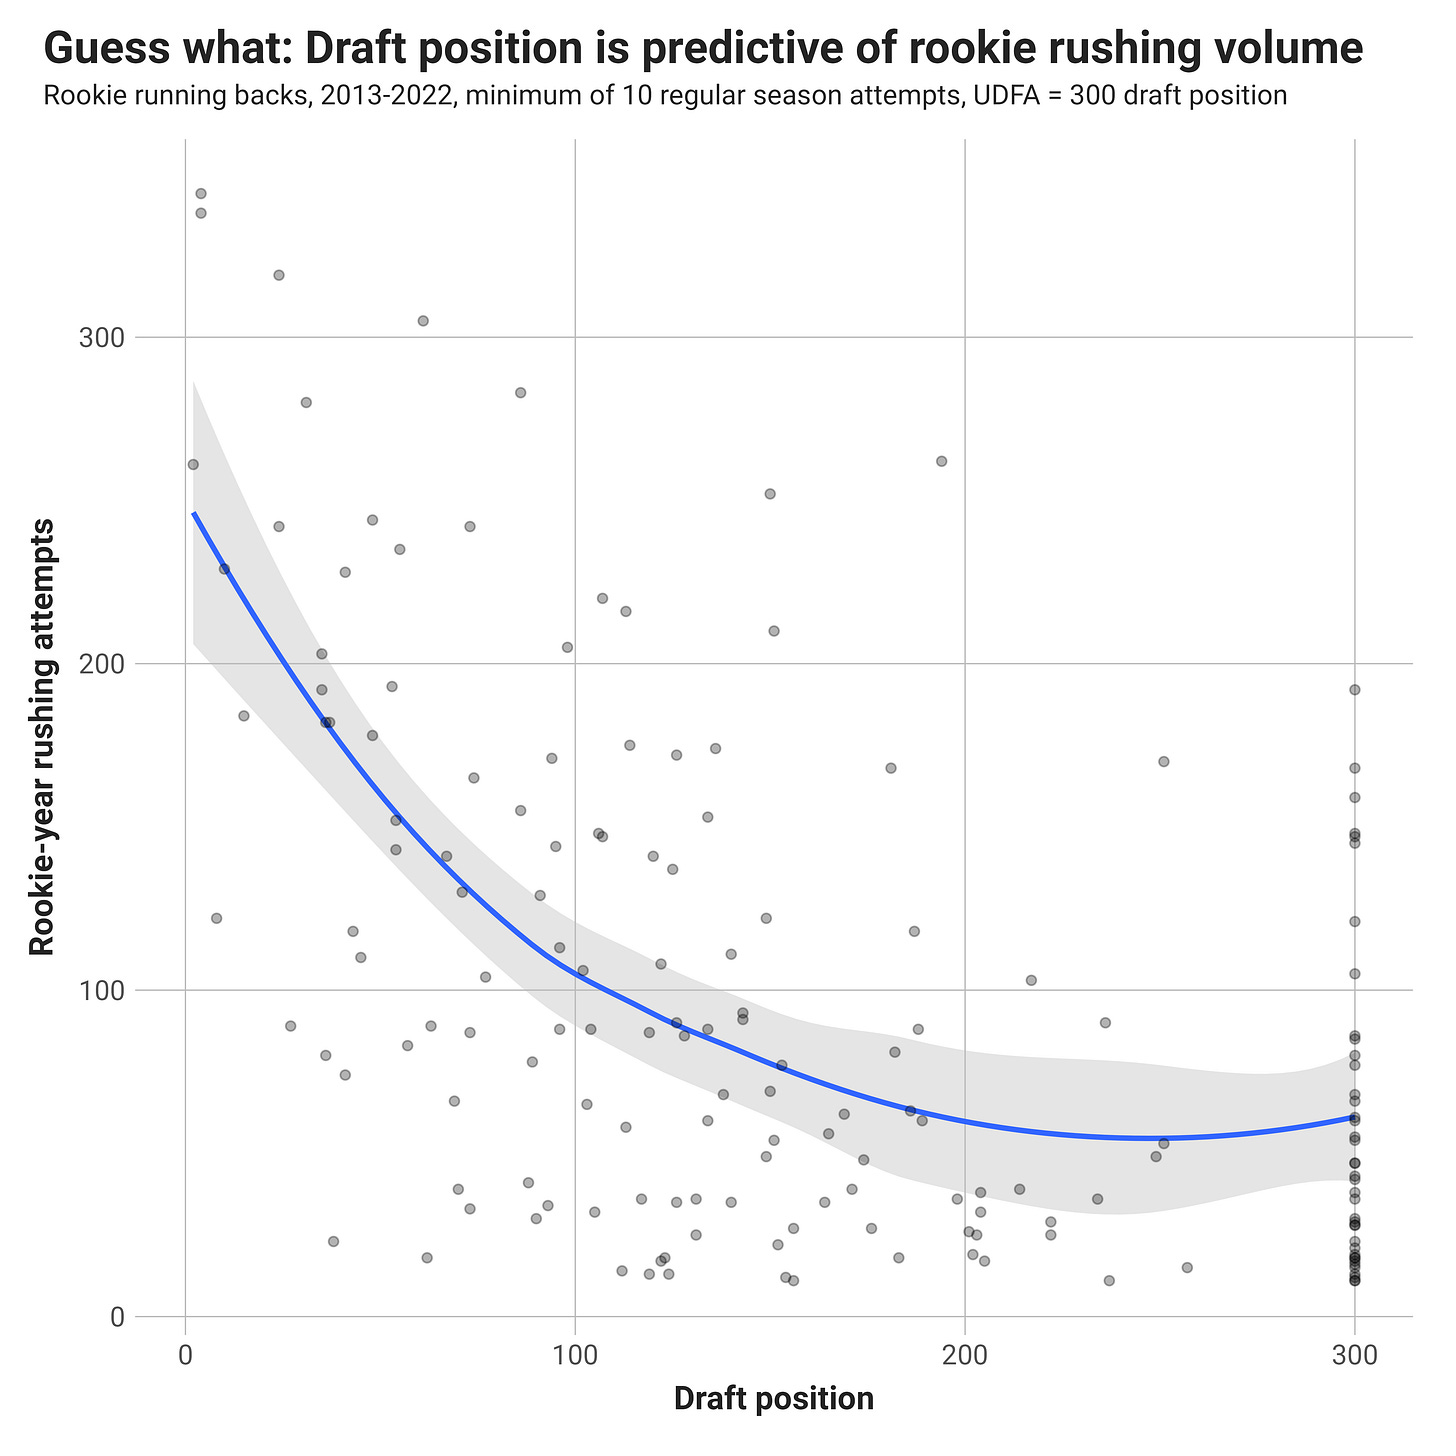
To recap the preseason historical data analysis, I was targeting rookie rushing yards over expectation when sorting through the preseason metrics most correlated. The expectation is based on draft position, which has a very strong relationship with rookie production.
Pure volume in the preseason didn’t matter much for predicting the regular season, but efficiency, in the form of yards per carry, did. Digging in further, we found that long runs and lots of yards after contact weren’t as important for projecting out rookie production as simple forced missed tackles per attempt, the stat most sticky and related to the specific running back, not the offensive line and team-level running scheme.
Keep reading with a 7-day free trial
Subscribe to Unexpected Points to keep reading this post and get 7 days of free access to the full post archives.


