

NFL Plus/Minus: Who Should Be The 2025 NFL Offensive Player Of The Year?
Using proprietary NFL Plus/Minus methodology to concretely assign value to all non-quarterback offensive players


I (re)introduced my favored methodology for measuring player value two years ago, and then applied it to all the non-quarterbacks in the NFL the last three seasons. Tyreek Hill was the most valuable offensive non-quarterback in my 2022 and 2023 seasonal analyses, though Justin Jefferson and Christian McCaffrey won the respective Offensive Player of the Year (OPOY) awards in those seasons. Jefferson and McCaffrey did finish third and second, respectively, in the seasons they won the awards, so my methodology isn’t far detached from voter sentiment, instead emphasizing different aspects of player value.
In 2024, my analysis was further off from the consensus, with Ja’Marr Chase my leader in points added, but Saquon Barkley the runaway winner of the OPOY award. Chase was second in the voting tabulations among non-quarterbacks, but he didn’t receive a single first-place vote. Barkley was relatively low in my value analysis, only ranking third among running backs, behind the ultra-efficiency Jahmyr Gibbs and Derrick Henry. The OPOY is not explicitly designed to give the most weight to “value”, but instead more of the most outstanding player, perhaps explaining the differences in rankings.
In current betting markets, Jaxon Smith-Njigba is the heavy favorite to win the OPOY award. As you’ll see below, I don’t have him ranked first in value, but it’s really close.
METHODOLOGY
I explain the methodology for valuing one facet, or phase, of player contributions in the NFL Plus/Minus introductory post: receiver route running. I don’t want to restate everything from that post, so please look back for clarification on the process. In this analysis, I’m applying that same methodology to the four aspects of non-quarterback value contribution for offensive players (rushing, route running, pass blocking and run blocking).
Before we get into the results of the analysis for every non-quarterback offensive position, let’s walk through a quick, specific example of how clustering works, using the route facet for wide receivers, highlighting some 2025 player results.
Without getting bogged down in the details, the graph above divides all wide receiver seasons from 2016 to 2025 with at least 50 routes into five different, color-coded clusters. For each receiver season, I calculated a number of efficiency and volume statistics and settled upon six for best differentiation receiver types: routes per game, slot rate, yards per route run, touchdown as a percentage of routes, first-down percentage, deep rate (percentage of 20+ yard targets) and yards per reception. I translated these seven features into principal components to minimize multicollinearity and make for easier visualization. The technique I used to form groups of similar receiver seasons is called k-means clustering. With this clustering technique, you choose the number of clusters, or groups, to form.
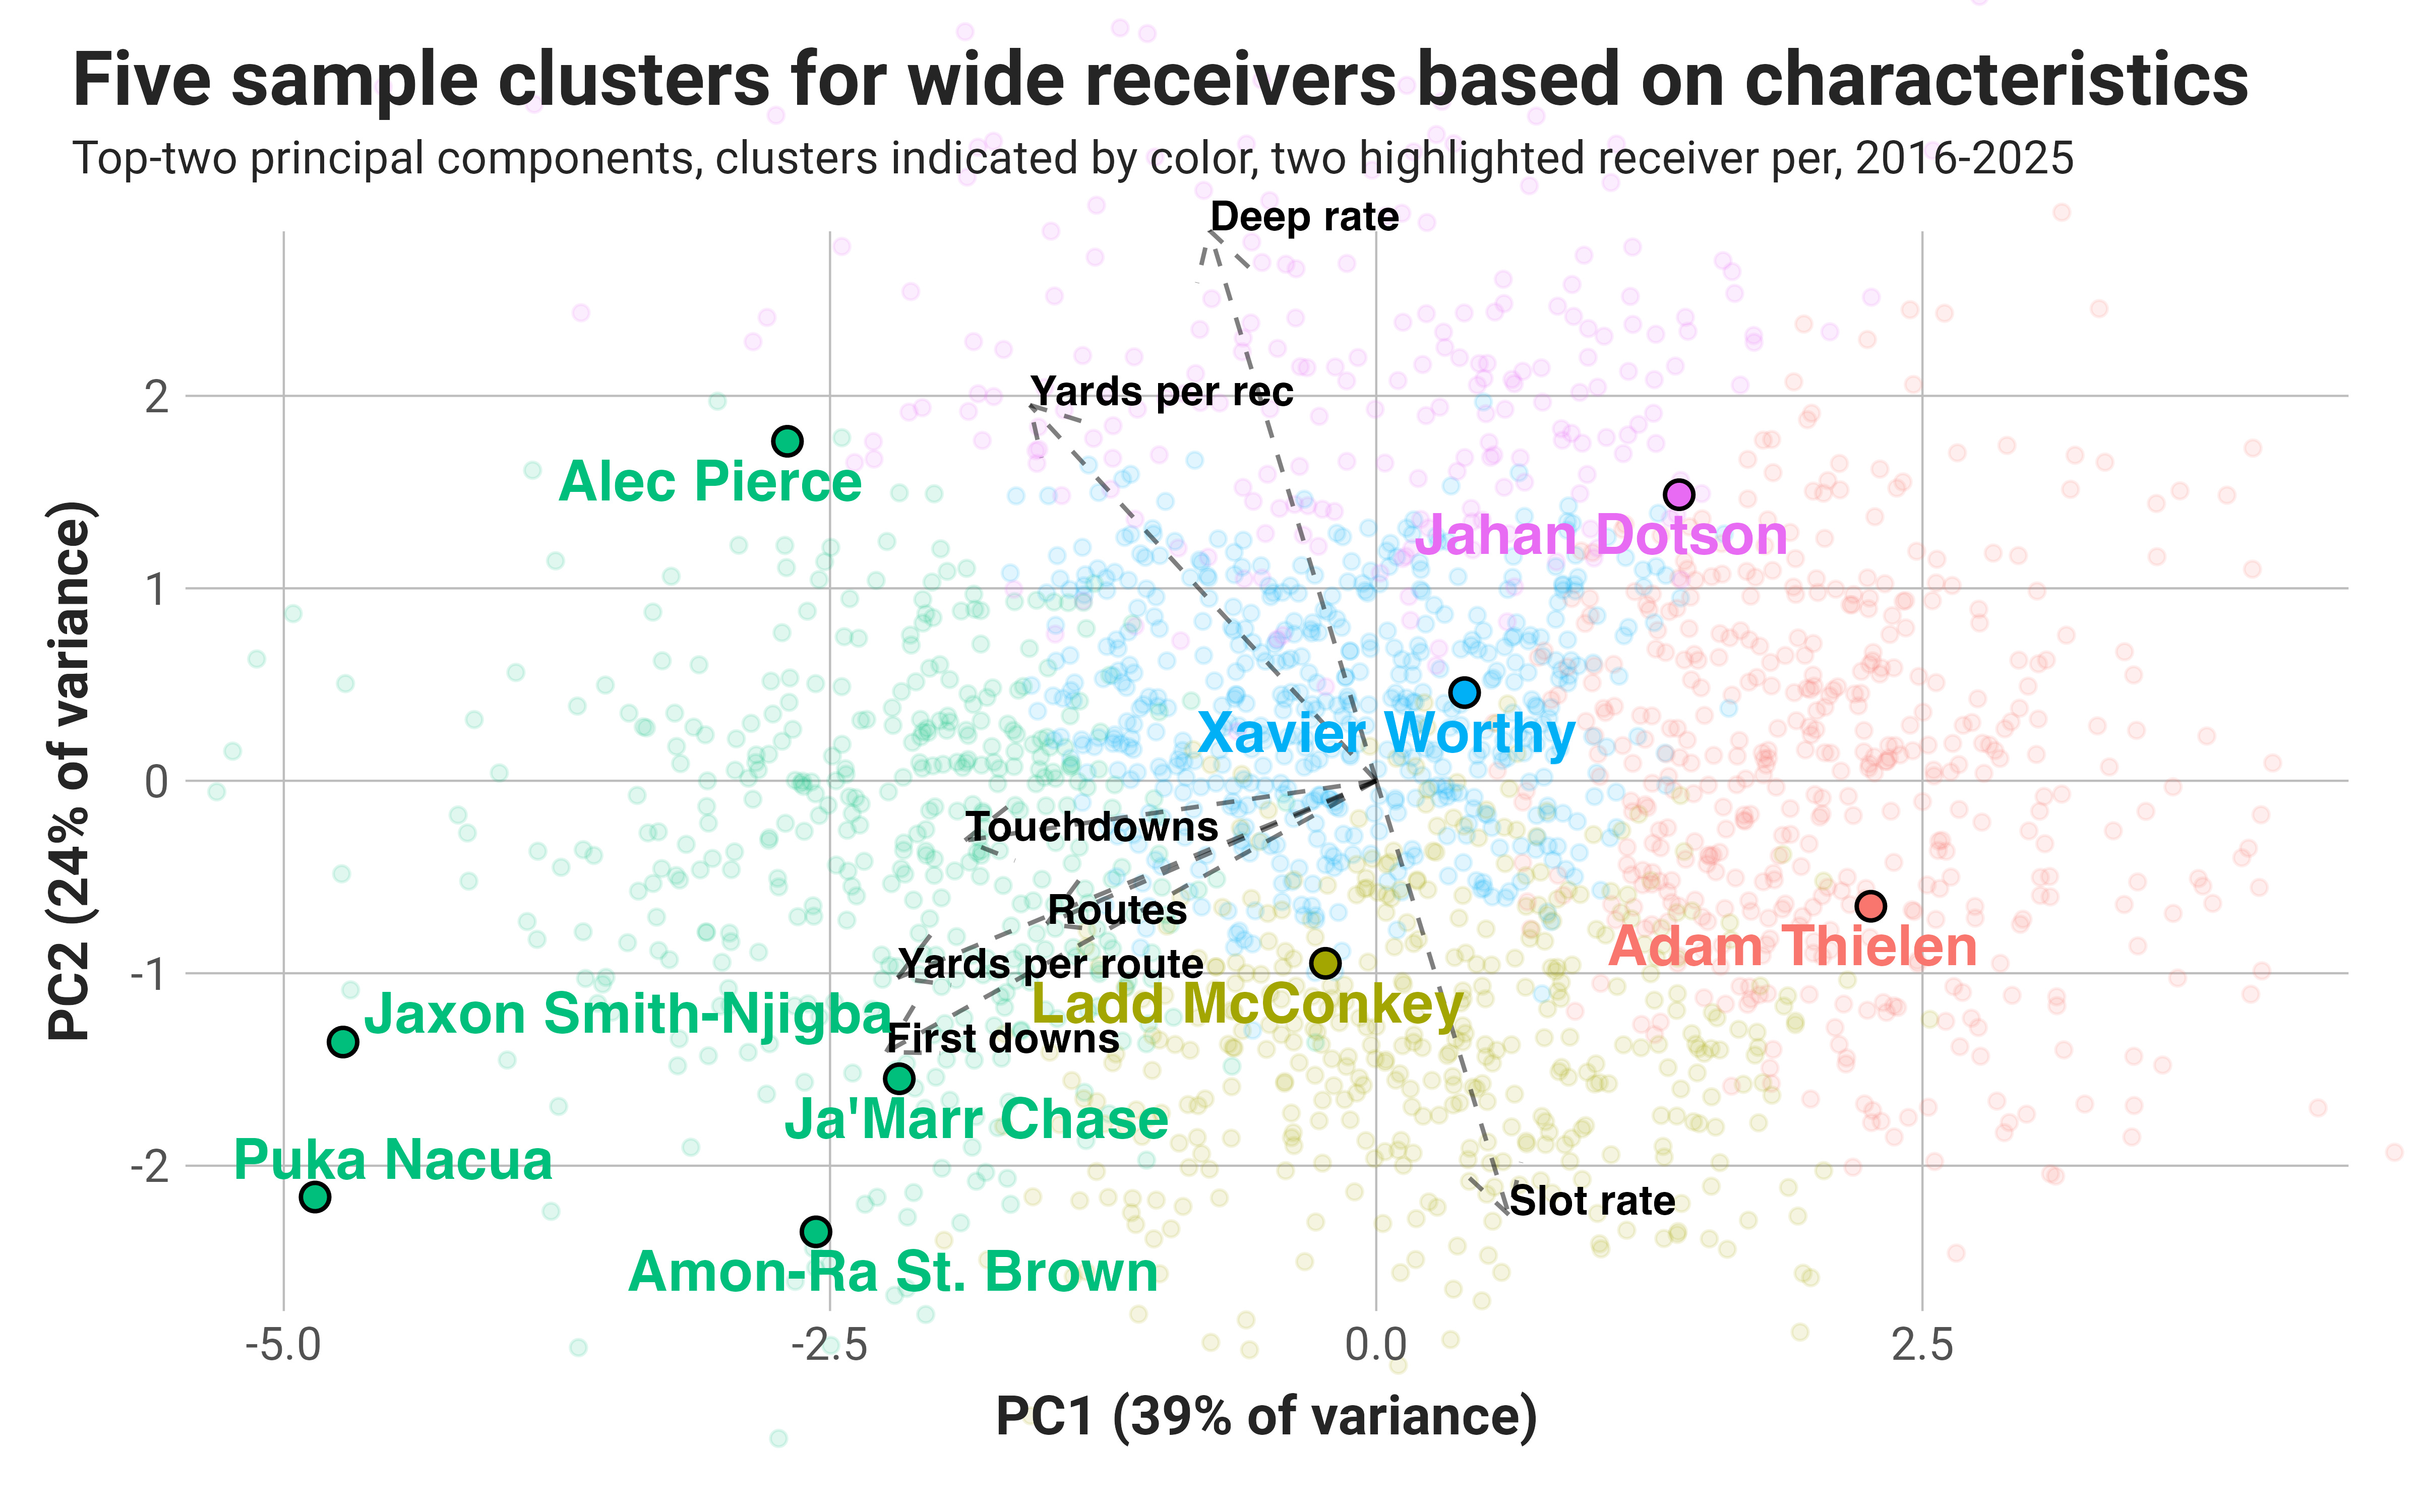
The dashed arrows extending out from the center of the plot show the directional force of the different features and the length of the arrows indicates the importance of each feature on the cluster assignment. The volume of routes and route-based efficiency for yards, first downs and touchdowns all pull in the same direction to the lower-right. Touchdowns are the least impactful feature, which makes sense as they are the noisiest stat of the group. Higher slot rate is directionally indicated by player seasons at the bottom of the plot, with yards per reception and deep rate mostly opposing features. It makes sense that slot receivers are less likely to go deep and have higher yards per reception, and vice versa for receivers who mostly line up out wide.
From these clusters, you can determine the cluster-averages for team offensive EPA when the receivers are on- or off-the-field, then apply them across the entire cluster, thereby reducing noise. Remember that this is just a simplified example of one clustering sample. In the total analysis, I repeat this exercise 100 times, with randomly assigned numbers of clusters, for each of the facets (route running, rushing, run blocking, pass blocking) for every position group. I then average up all the cluster value estimates for each player to get an overall number. There are also additional steps to add stability to the results, like application of the results through a regression, that bring us to the final numbers.
THE RESULTS
With the nerd stuff out of the way, let’s dive into the results for each position, before bringing them all together to see the most valuable non-quarterbacks on offense in 2025. First, let’s start with wide receivers.
