NFL Plus/Minus: Tyreek Hill is the Offensive Player of the Year
Using the recently introduced NFL Plus/Minus methodology to concretely assign value to all non-quarterback offensive players
The NFL Honors ceremony is tonight, and everything from Most Valuable Player to Comeback Player of the Year will be revealed. Finalists for every category have been announced, including those for Offensive Player of the Year. OPOY is a strange award, with quarterbacks qualifying for the award, but often given to a non-quarterback as they have little chance in the modern era to win MVP.
Wide receiver Justin Jefferson is the favorite to win the award, with Jalen Hurts and Tyreek Hill the next strongest contenders. Patrick Mahomes is also a finalist, but his odds are lower under the assumption he’ll likely win MVP and won’t be rewarded in both categories.
Focusing in on the two non-quarterback finalists, Jefferson has the advantage on Hill in most statistical categories. Jefferson has more catches (128 to 119), receiving yards (1,809 to 1,710) and touchdowns (8 to 7). But value isn’t only about volume: it’s about volume and efficiency.
Jefferson's counting-number statistical advantage masks significantly greater opportunity for him to compile stats. Jefferson ran 690 routes this season, the most in the NFL. Hill ranked 31st with 534 routes run. Both played 17 games, so availability wasn’t the differentiating factor as much as pass heaviness of the offense.
If Jefferson was more productive overall, yet Hill was more productive per opportunity, how do we judge their relative value added? That’s where the NFL Plus/Minus metric I introduced this week can help us. NFL Plus/Minus harnesses several years of player participation data and team-level advanced stats to measure player contributions in a comparable, points-denominated basis.
METHODOLOGY
I explain the methodology for valuing one facet, or phase, of player contributions in the NFL Plus/Minus introductory post: receiver route running. I don’t want to restate everything from that post, so please look back for clarification on the process. In this analysis, I’m applying that same methodology to the four aspects of non-quarterback value contribution for offensive players (rushing, route running, pass blocking and run blocking).
Before we get into the results of the analysis for every non-quarterback offensive position, let’s walk through a quick, specific example of how clustering works, using the rushing facet for running backs.
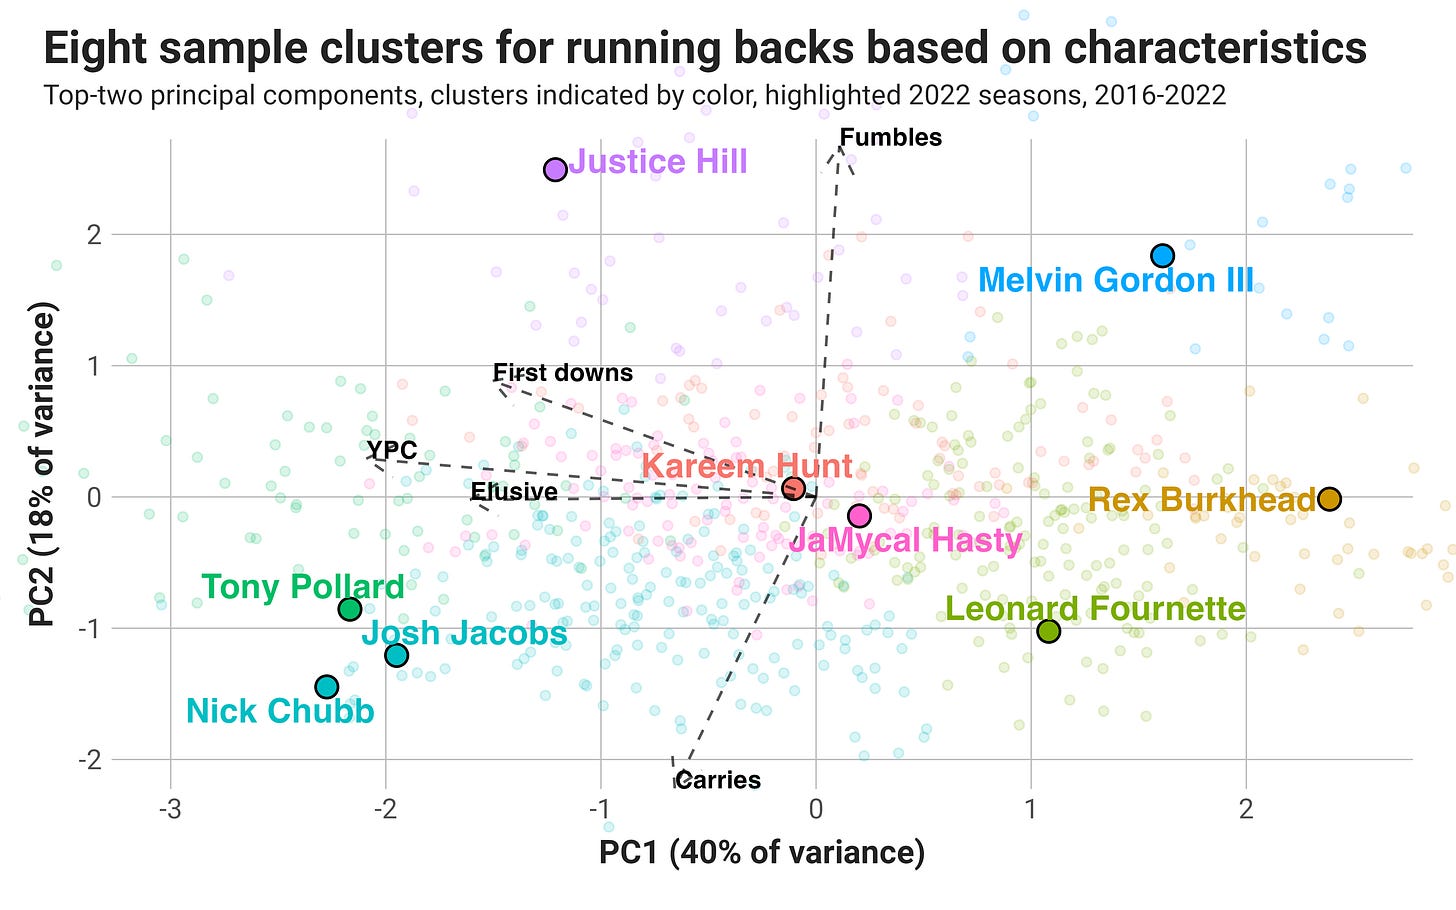
Without getting bogged down in the details, the graph above divides all running back seasons from 2016 to 2021 with at least 25 attempts into eight different, color-coded clusters. The metrics used to group the clusters include rushing attempts per game, yards per carry (YPC), rate of forced missed tackles (Elusive), rate of generating first downs and fumble rate. The highlighted player seasons are from their respective 2022 campaigns.
The dashed arrows extending from the center illustrate the gravitational pull of those attributes on the plot, with the length of the arrow indicating the strength of the metric in determining player clusters. Fumbles are rare and random, but really important in valuation. One fumble can negative dozens of successful runs in expected points lost.
Players to the left are generally more efficient with their carries, those further down getting higher volume on a per-game basis, and those at the top with higher fumble rates. We can then group this clusters and determine the overall plus-minus for EPA when those players were on and off the field, estimating the contributions of the individual players, who’s specific on and off the field splits have tons of noise.
In this example, the cluster that included Tony Pollard was the most valuable rusher per attempt, though with generally more limited volume than the similarly efficiency cluster with Nick Chubb and Josh Jacobs. We can then apply these cluster-level numbers back to each player-season in the cluster, assuming the cluster is a less noisy and better representation of the player’s value than their individual numbers.
To further enhance the specificity of the results and reduce noise, I repeat this clustering process hundreds of times, tweaking the number of clusters and the matching parameters, thereby making each player’s individual NFL Plus-Minus results an aggregation of hundreds of matching clusters. The results below follow this process for each of the four value facets.
THE RESULTS
With the nerd stuff out of the way, let’s dive into the results for each position, before bringing them all together to see the most valuable non-quarterbacks on offense in 2022.


