


We’re three weeks in the 2026 NFL season and enough data has accumulated to have some idea how good teams actually will be going forward. The old NFL maxim from Bill Parcells that “you are what your record says you are” has a degree of truth: no one is making the playoffs on adjusted scores and what they say your record should be. At the same time, assessing team strength isn’t as simple as sorting the NFL standing by wins, using point differential as a tiebreaker and then printing the results, even if the media power rankings complex mostly resembles that exercise.
At Unexpected Points we have the concept of adjusted scores to compare with actual results, thereby lowering the noise from highly volatile aspects of play, like turnovers, late-down conversions, special teams play and penalties. It’s not that these aspects of play don’t matter, it’s that their influence on game results outweigh what they tell us about the fundamental qualities of the teams involved.
In this post, I’m going to aggregate the adjusted scores found in my advanced games reviews for every team through three weeks of play, make comparison to actual results, and inspect further as to whether teams shown as underperforming fundamentals (potential hidden gems) and those who have outperformed (potential frauds) are really the values and traps they appear to be.
Let’s take a look at a simple plot of actual point differential versus adjusted score differential below:
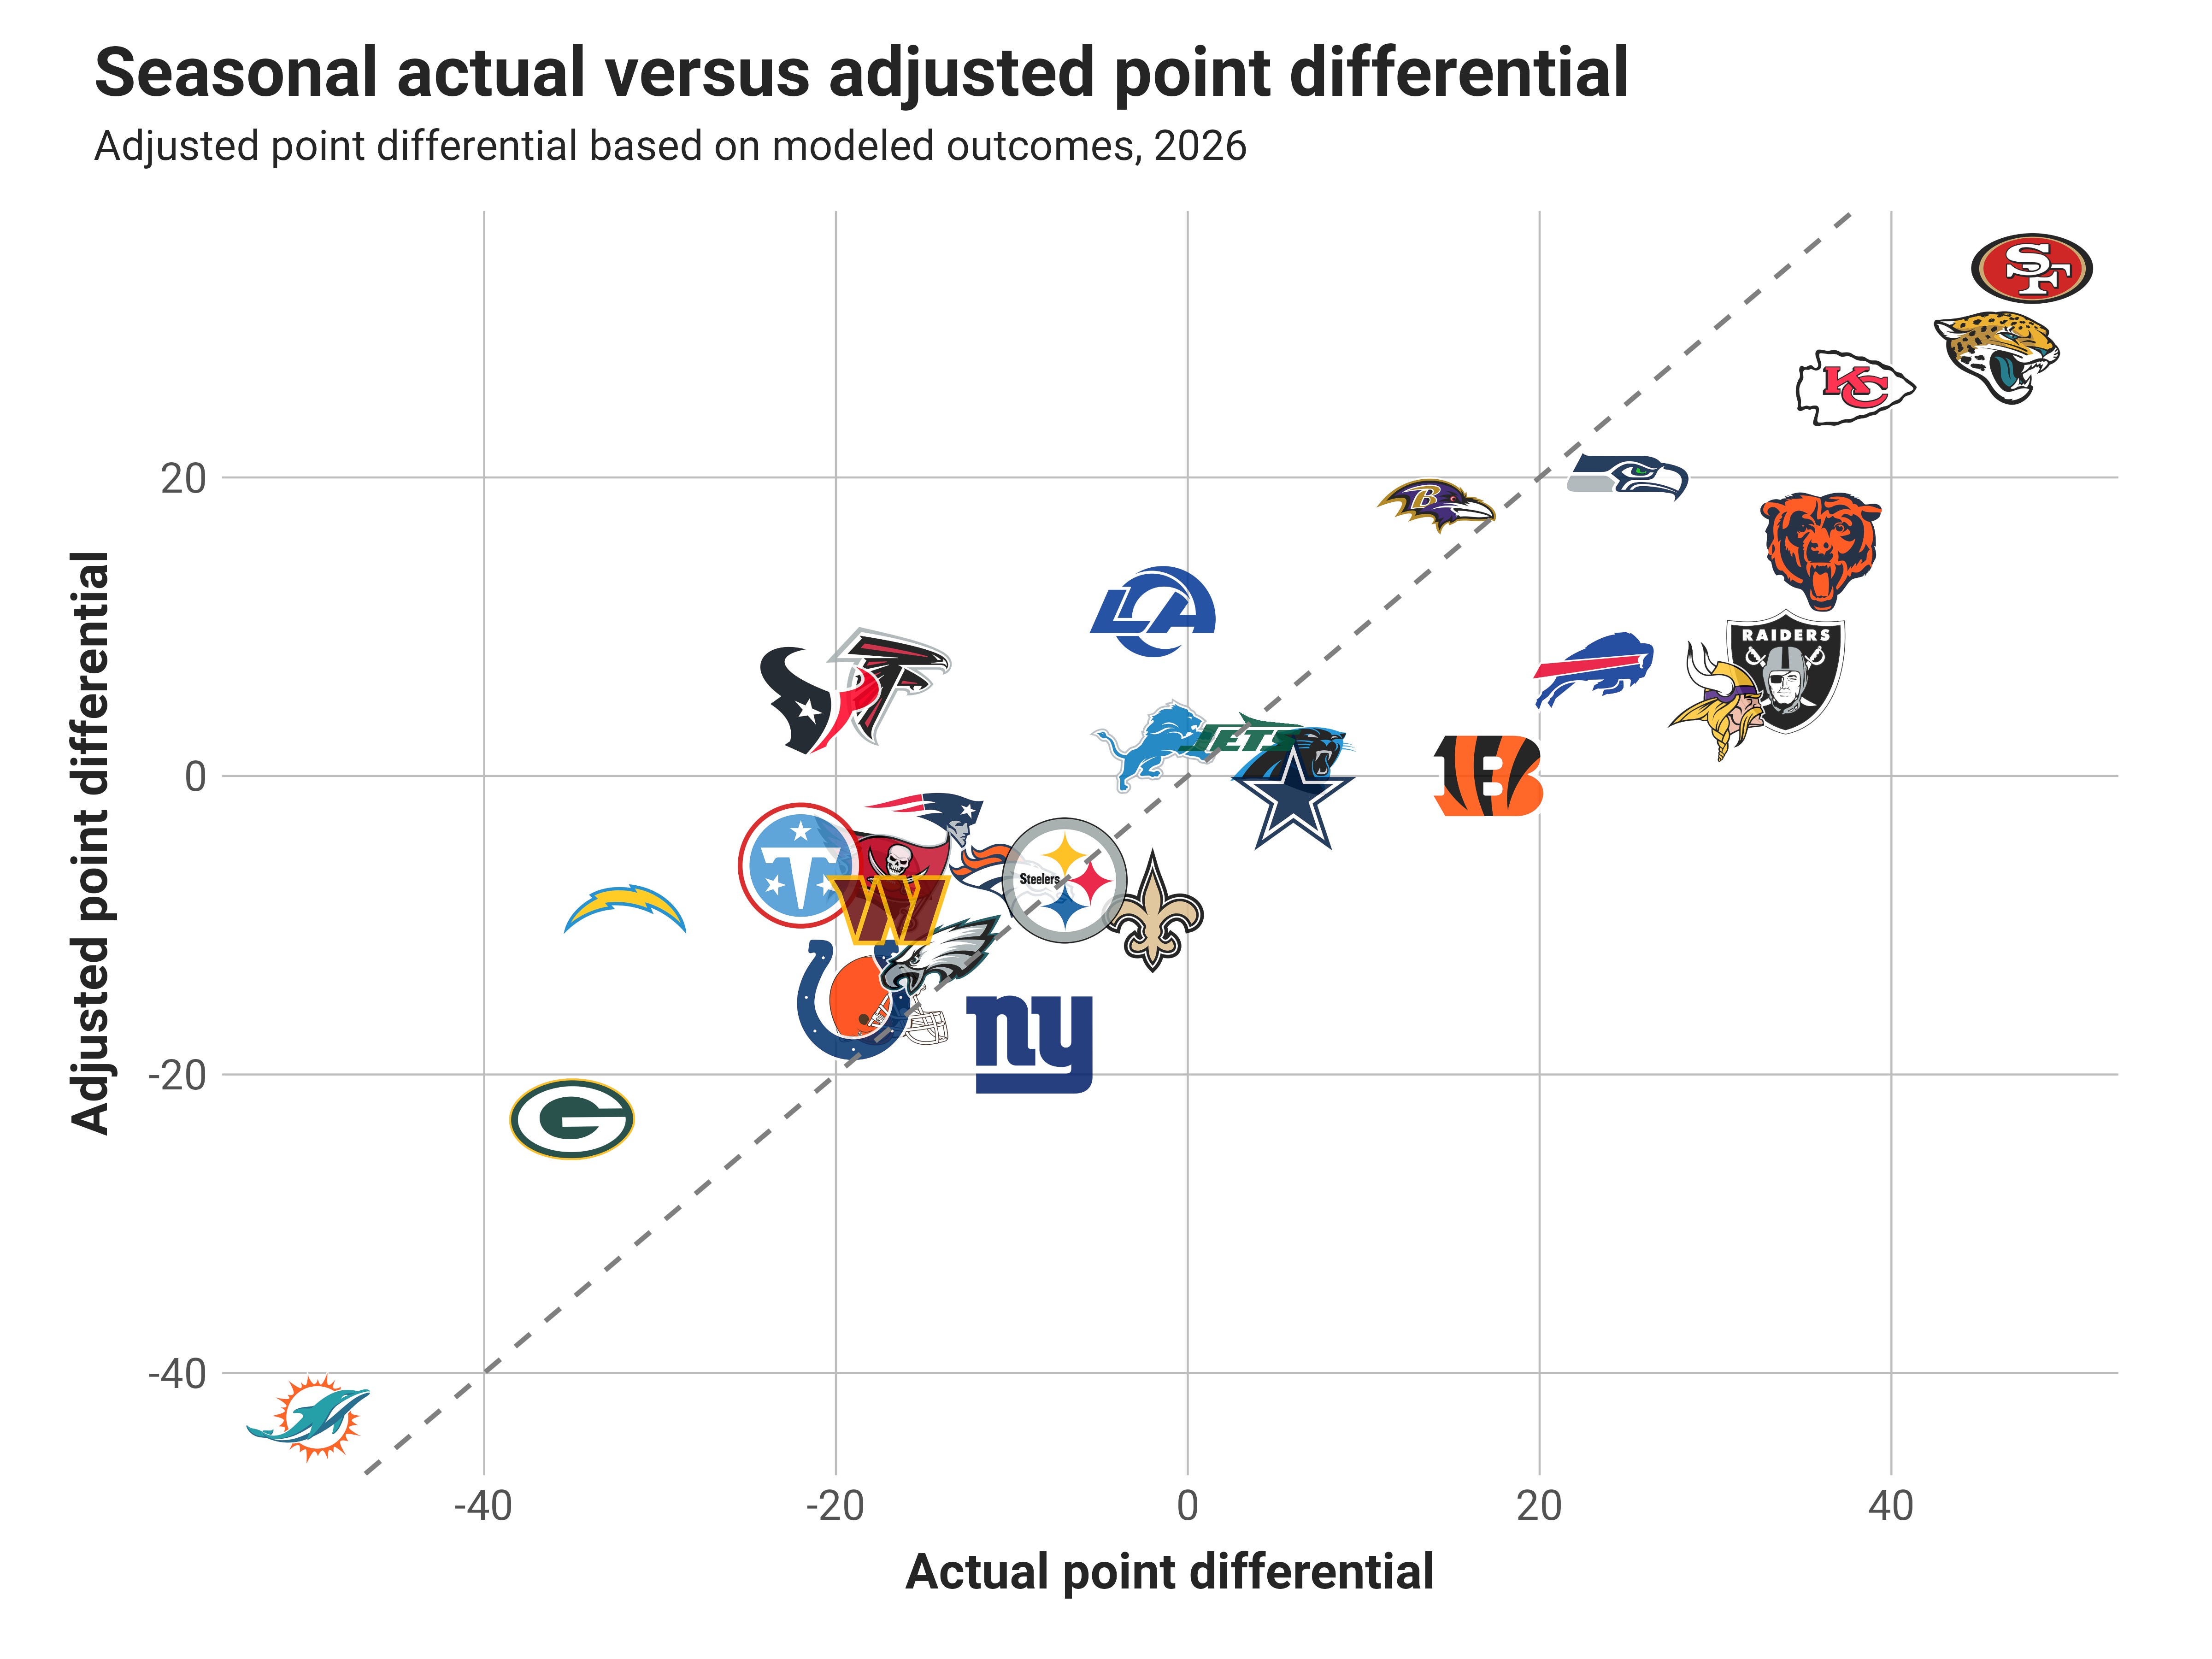
A couple foundational contextual points to make when comparing actual and adjusted scores. First, the differentials in actual scores are generally greater in any given game, since the adjustments lower the impact of high-variance plays that drive larger swings in EPA and therefore actual scoring. Second, outlier teams in either direction will generally diverge from the trendline above, where one actual point differential is marked against one adjusted point differential. Strong performance is generally a combination of skill and luck, and poor performance generally a combination of a lack of skill and poor luck.
These two factors explain why the top teams in positive point differential all look less strong by adjusted score differential, and nearly all of the poor performers display the opposite dynamic.
If we replace the proportional, one-to-one dashed line with the trendline derived from the plotted results, we get a better idea of which teams have actually performed better/worse than expected based on the expected relationship between actual and adjusted scores.
